estimates of jobs dearth/insufficiency/short-fall/shortage by sex
plug: graphs prepared using Mariner Calc
This is me, raising my banners high, seeking people with whom I'd like to work, live, trade, support. All flags flying!
updated: 2026-01-18
| jgo Resume | jgo Reading Room |
| jgo Econ Data | jgo Econ News Bits |
| jgo's Links | |
| jgo's Work in Progress | |
| Kermit's home page | |
| Page Bottom | |
|
"Res ipsa loquitur." (The facts speak for themselves.) |
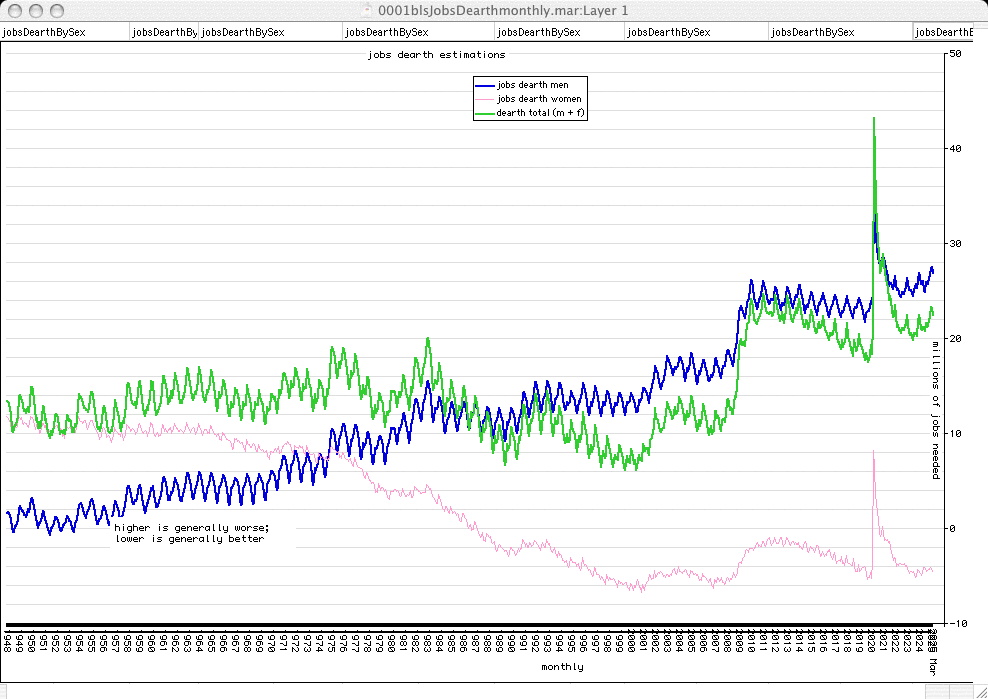
Estimations of Jobs Dearth
(Insufficiency/ Shortfall/ Shortage/ Deficit/ Drought/ Famine/ Inadequacy/ Insufficiency/ Lack/ Lacuna/ Paucity/ Pinch/ Scantiness/ Under-Supply/ Want of real, long-term employment opportunities as opposed to temp gigs)
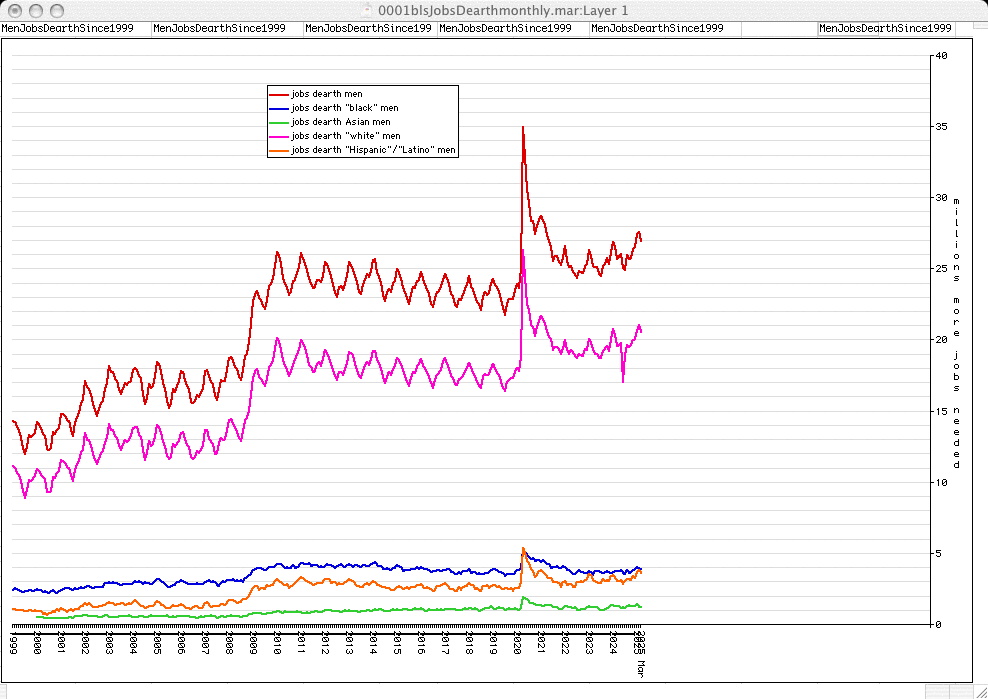
estimates of jobs dearth/insufficiency/short-fall/shortage by sex
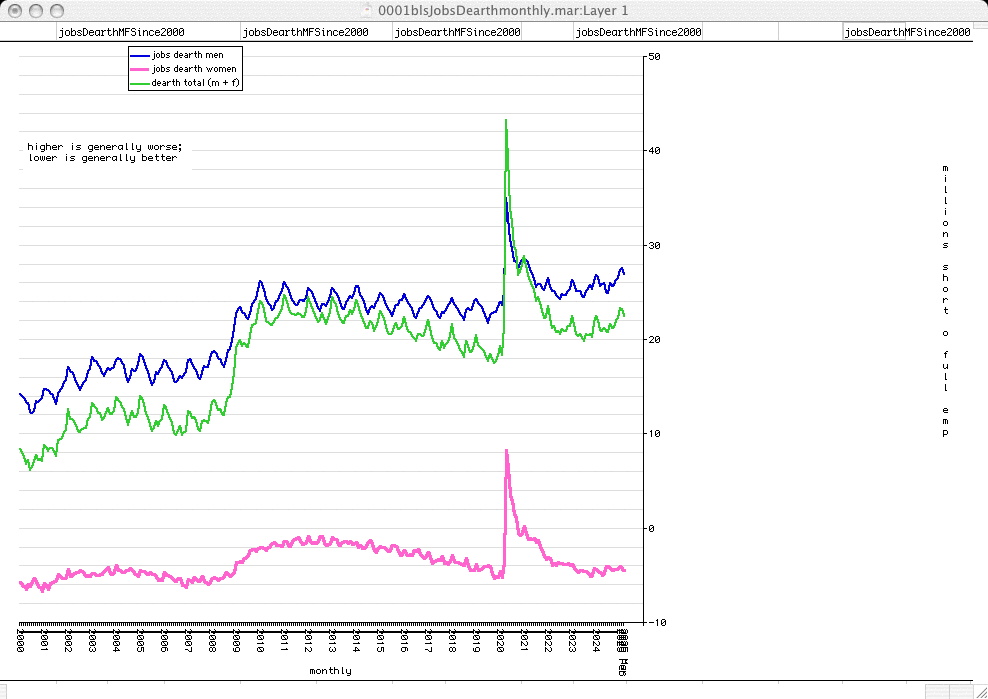
estimates of jobs dearth/insufficiency/short-fall/shortage by sex (since 2000)
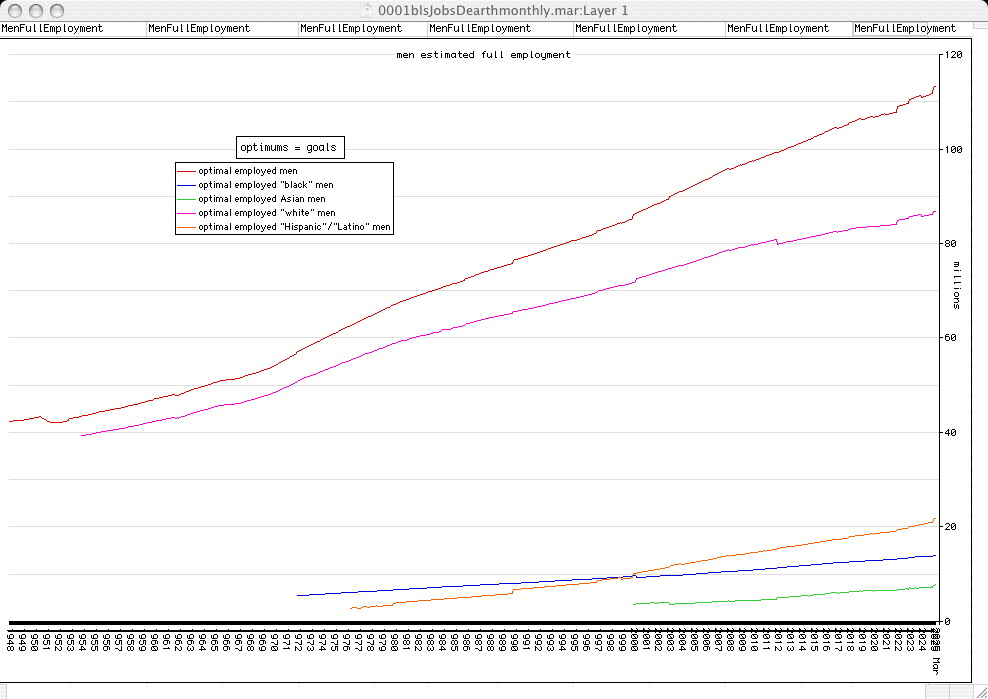
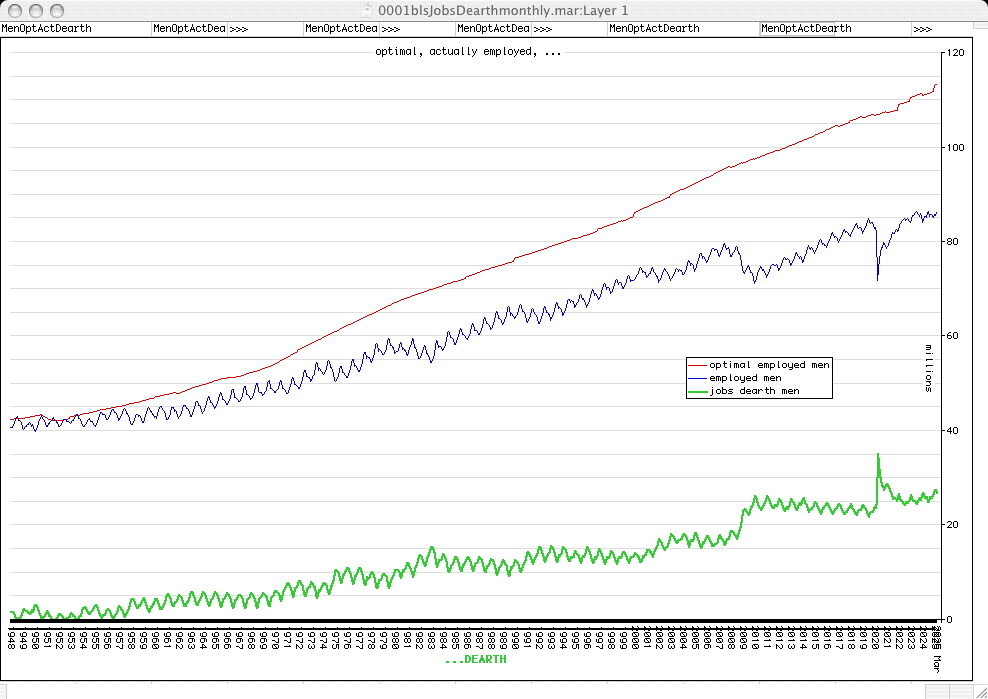
estimated optimal, actual, and dearth of employment for all men
based on:
Civilian, Non-Institutionalized Population, 16 years and older (CivPop=CNIP16+):
LNU00000001 (CivPop=CNIP16+ men M)
LNU00000002 (CNIP16+ women M)
LNU00000000 (CNIP16+ aggregate)
LNU00000006 (CNIP16+ "blacks")
LNU00032183 (CNIP16+ "Asians")
LNU00000003 (CNIP16+ "whites")
LNU00000009 (CNIP16+ "Hispanics"/"Latinos")
CNIP16+ = civilian, non-institutionalized population, 16 years & older
LNU02300001 (employed ÷ CNIP16+ ratio men)
LNU02300002 (employed ÷ CNIP16+ ratio women)
LNU02300000 (employed ÷ CNIP16+ ratio aggregate)
LNU02300006 (employed ÷ CNIP16+ ratio "blacks")
LNU02332183 (employed ÷ CNIP16+ ratio "Asians")
LNU02300003 (employed ÷ CNIP16+ ratio "whites")
LNU02300009 (employed ÷ CNIP16+ ratio "Hispanics"/"Latinos")
LNU02000001 (men employed)
LNU02000002 (women employed)
LNU02000000 (aggregate employed)
LNU02000006 ("blacks" employed)
LNU02032183 ("Asians" employed)
LNU02000003 ("whites" employed)
LNU02000009 ("Hispanics"/"Latinos" employed)
retrieved via https://data.bls.gov/series-report
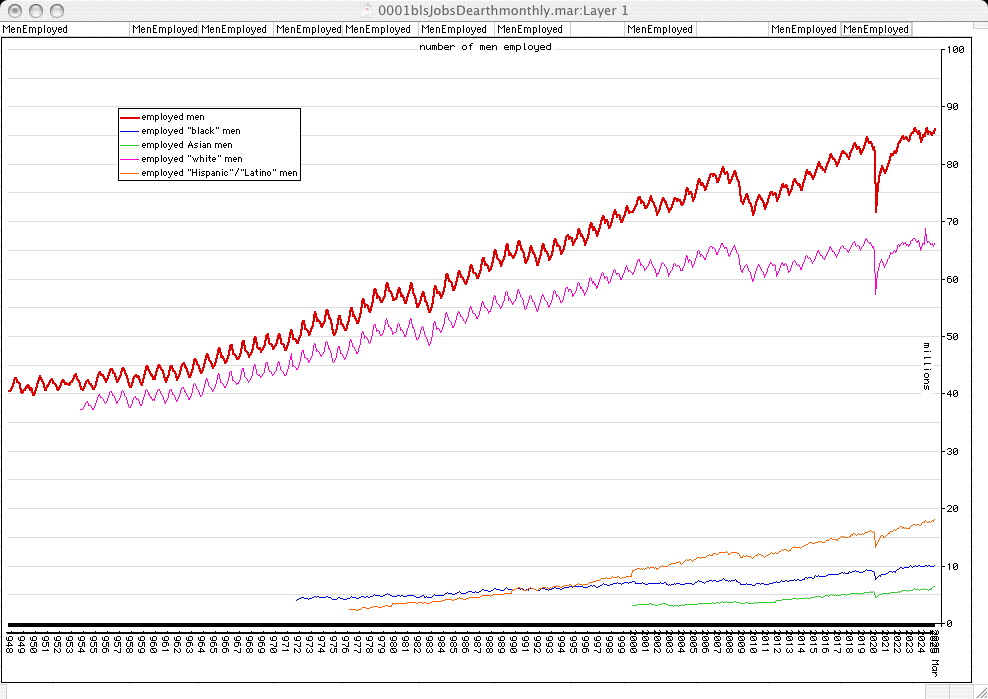
men 16 years & older employed (by race &/or ethnicity)
LNU02000001 (employed men)
LNU02000007 (employed "black" men)
LNU02032301 (employed "Asian" men)
LNU02000004 (employed "white" men)
LNU02000010 (employed "Hispanic"/"Latino" men)
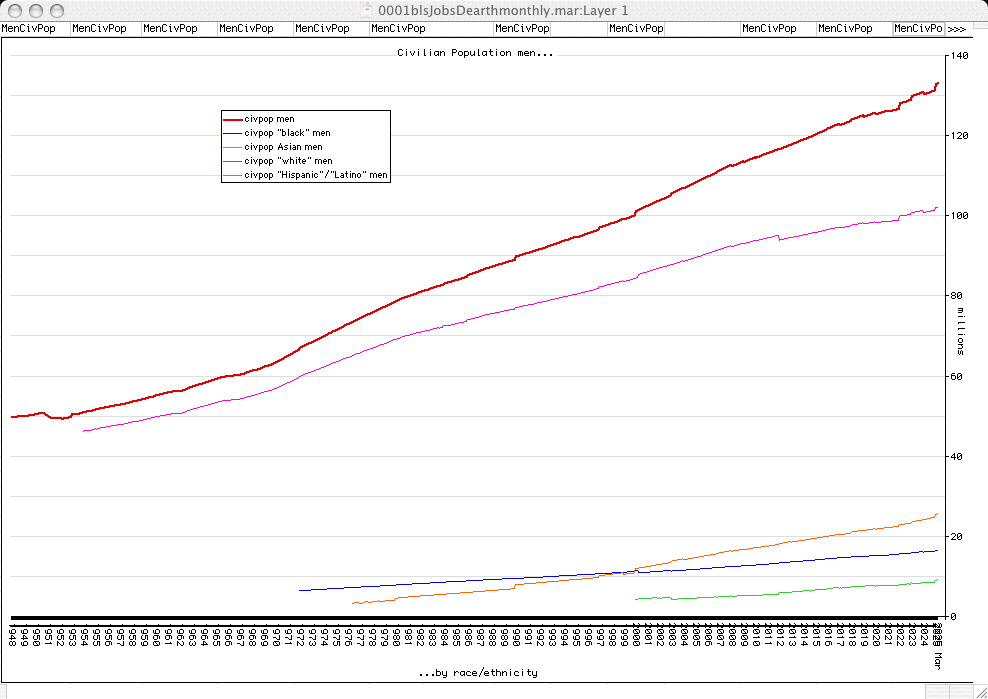
civilian non-institutionalized population of men 16 years & older (by race &/or ethnicity)
LNU00000001 (CNIP16+ men)
LNU00000007 (CNIP16+ "black" men)
LNU00032301 (CNIP16+ "Asian" men)
LNU00000004 (CNIP16+ "white" men)
LNU00000010 (CNIP16+ "Hispanic"/"Latino" men)
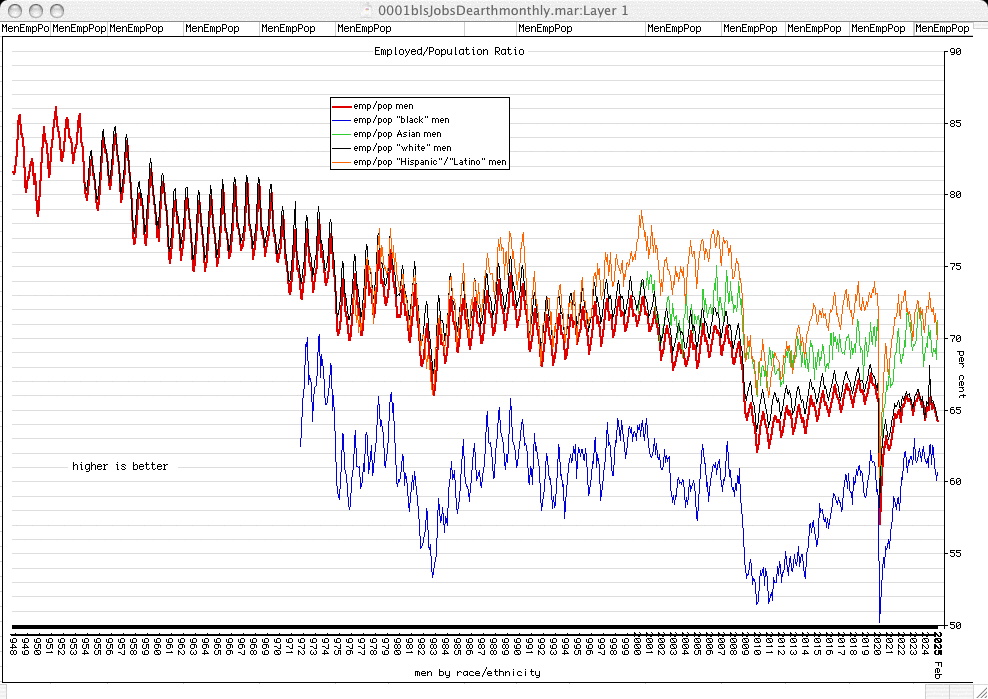
ratios of men employed÷civilian male population (by race &/or ethnicity)
LNU02300001 (employed÷CNIP16+ men)
LNU02300007 (employed÷CNIP16+ "black" men)
LNU02332301 (employed÷CNIP16+ "Asian" men=LNU02032301/LNU00032301)
LNU02300004 (employed÷CNIP16+ "white" men)
LNU02300010 (employed÷CNIP16+ "Hispanic"/"Latino" men)
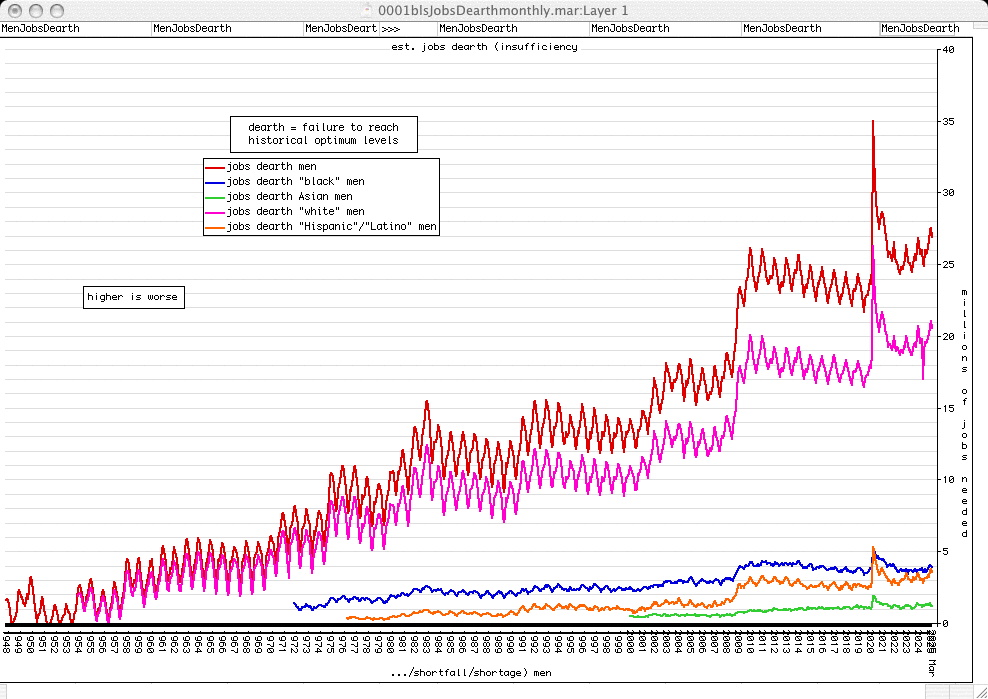
estimates of jobs dearth/insufficiency/short-fall/shortage for men (by "race" &/or ethnicity)
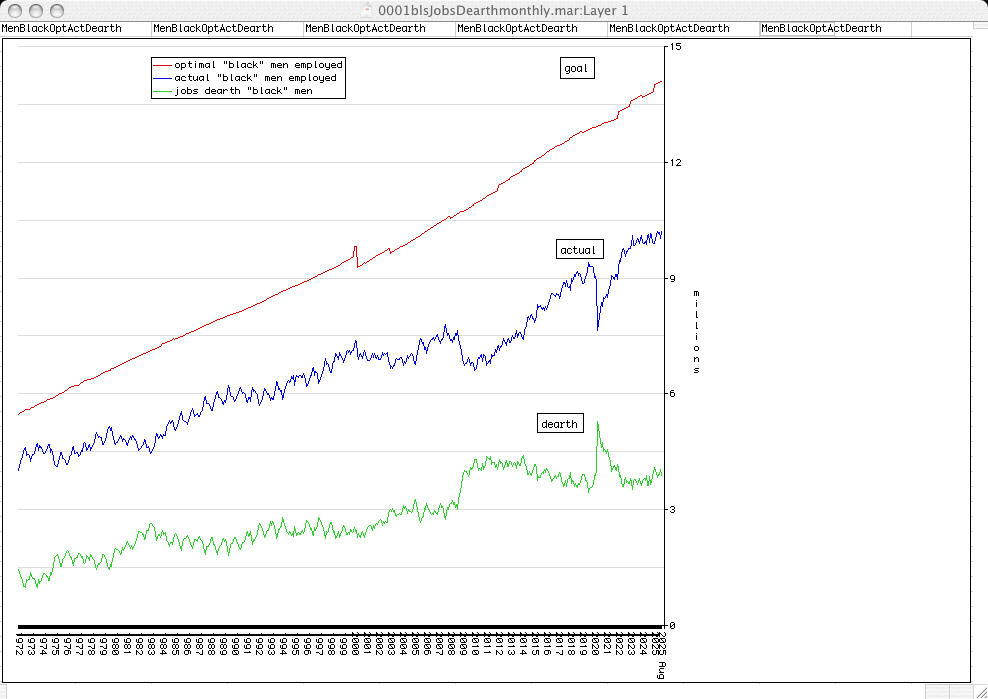
estimated optimal, actual, and dearth of employment for all "black" men
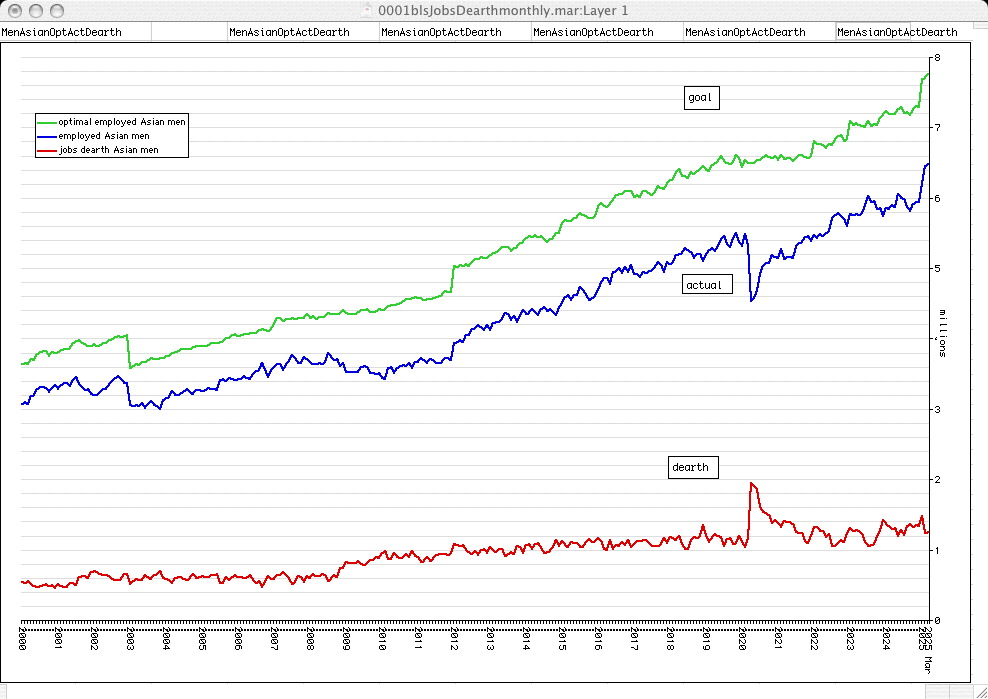
estimated optimal, actual, and dearth of employment for all "Asian" men
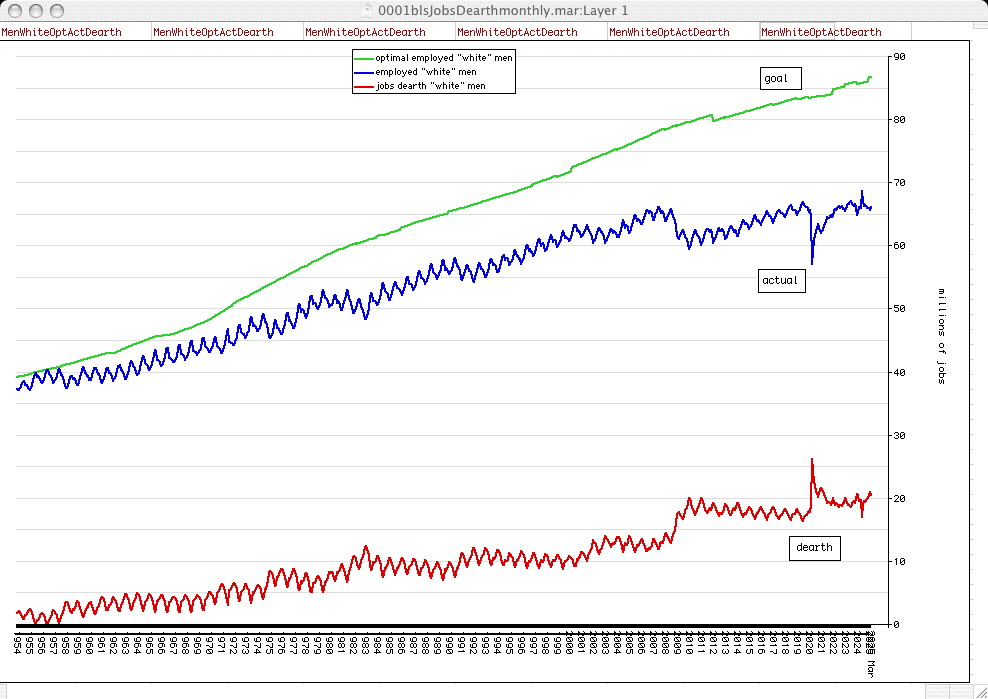
estimated optimal, actual, and dearth of employment for all "white" men
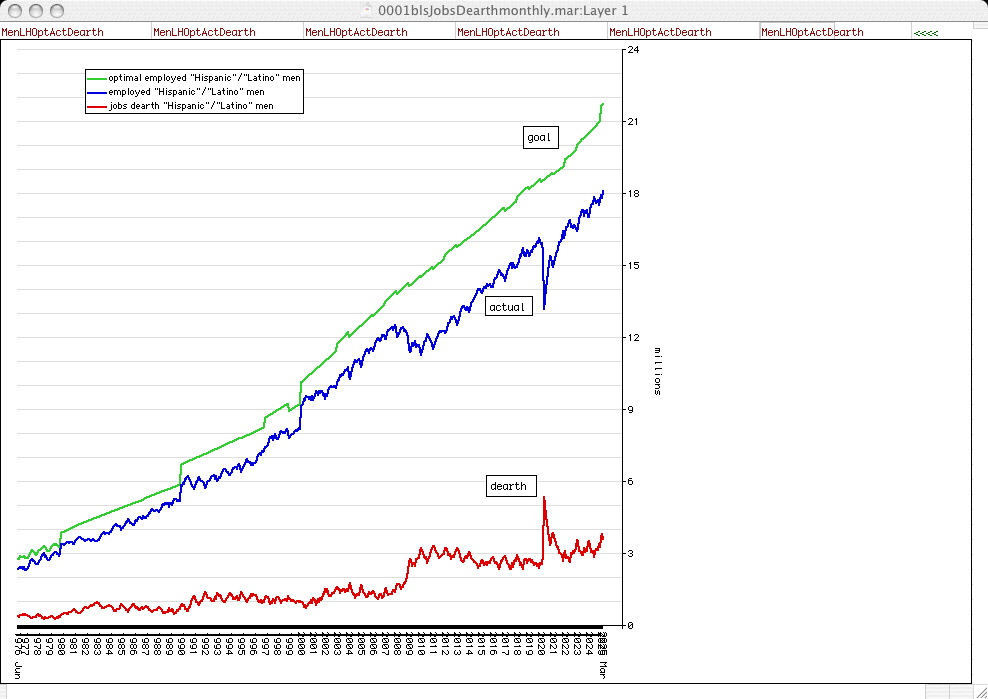
estimated optimal, actual, and dearth of employment for all "Latino"/"Hispanic" men
LNU02000000 (employed all)
LNU02000006 ("blacks" employed)
LNU02032183 ("Asians" employed)
LNU02000003 ("whites" employed)
LNU02000009 ("Hispanics"/"Latinos" employed)
LNU00000000 (CNIP16+ all)
LNU00000006 (CNIP16+ "blacks")
LNU00032183 (CNIP16+ "Asians")
LNU00000003 (CNIP16+ "whites")
LNU00000009 (CNIP16+ "Hispanics"/"Latinos")
LNU02300000 (employed/CNIP16+ all)
LNU02300006 (employed÷CNIP16+ ratio "blacks")
LNU02332183 (employed÷CNIP16+ ratio "Asians")
LNU02300003 (employed÷CNIP16+ ratio "whites")
LNU02300009 (employed÷CNIP16+ ratio "Hispanics"/"Latinos")
Plus a fudge-factor for each, trying to reflect personal house-wife/house-husband preference from the rare article & book I recall: nearly all male-type-people over the age of 15 (yes, even "seniors"/"seasoned citizens" would prefer economic or compensated employment, and the survey said about half of female-type-people.
"From 1900 to 1930, the proportion of females over 16 in the labor force fluctuated at about 20%. After the beginning of the Second World War, employment outside the home rose very rapidly, and except for a reversal after the war, it kept on rising at a remarkably steady pace: 30% in 1941, 40% in 1960, 50% in 1980, 60% in 2000... Most married women [said they] did not work because they wanted to. They needed the money to help pay the mortgage and put the children through college. In an economy of high inflation, falling real [inflation-adjusted] wages, and frequent lay-offs, the only way that most USA families could [keep up with the costs of living or] get ahead was for both the husband and the wife to bring home a pay-check." --- David Hackett Fischer 2005 _Liberty and Freedom_ pg656 (citing census bureau _Historical Statistics of the United States of America_; BLS _Employment & Earnings_; James T. Patterson 1996, 1997 _Grand Expectations: The USA 1945-1974_ pg644)
I am mildly concerned at the jaggies, discontinuity artifacts, in some of the graphs. The ones I've looked at closely seem legitimate reflections of reality (or at least available BLS data). But will be looking at them some more.
(BLS/Census used to try to track employment of everyone over 13.)
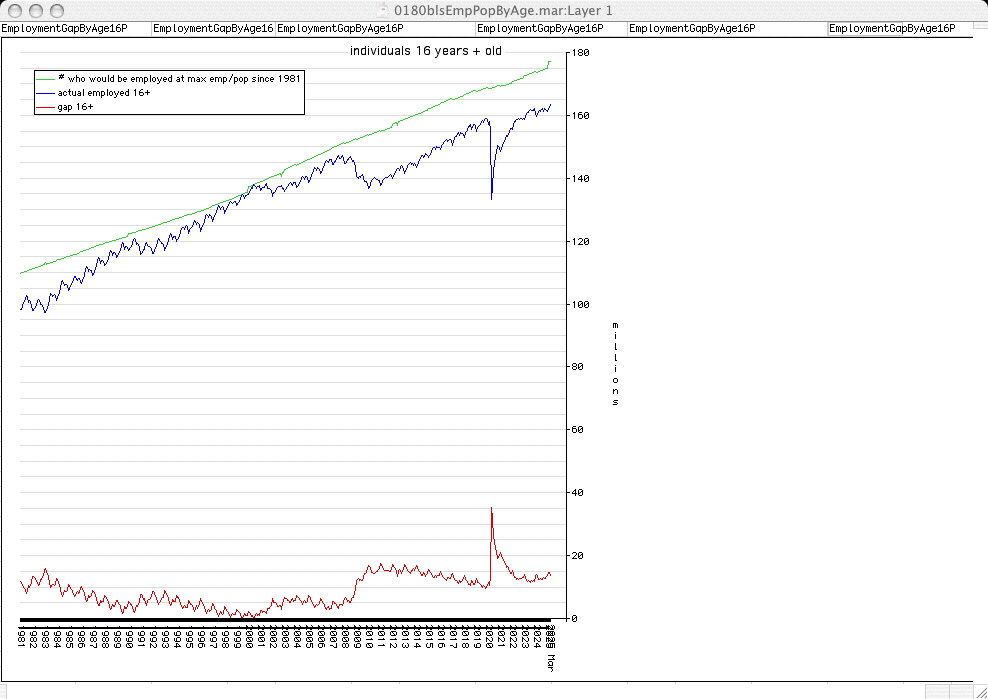
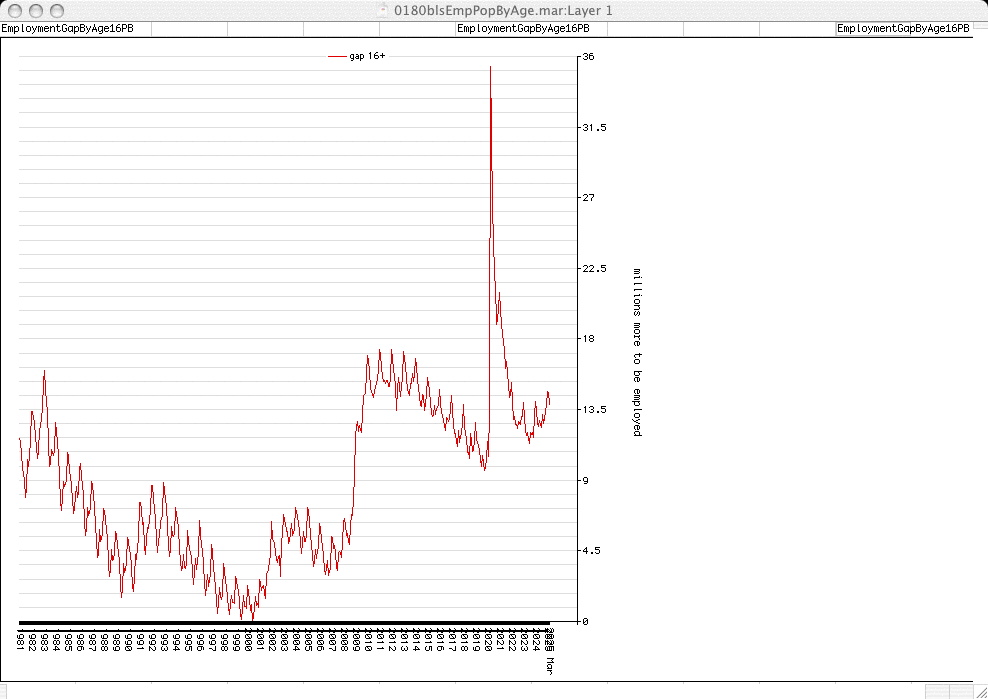
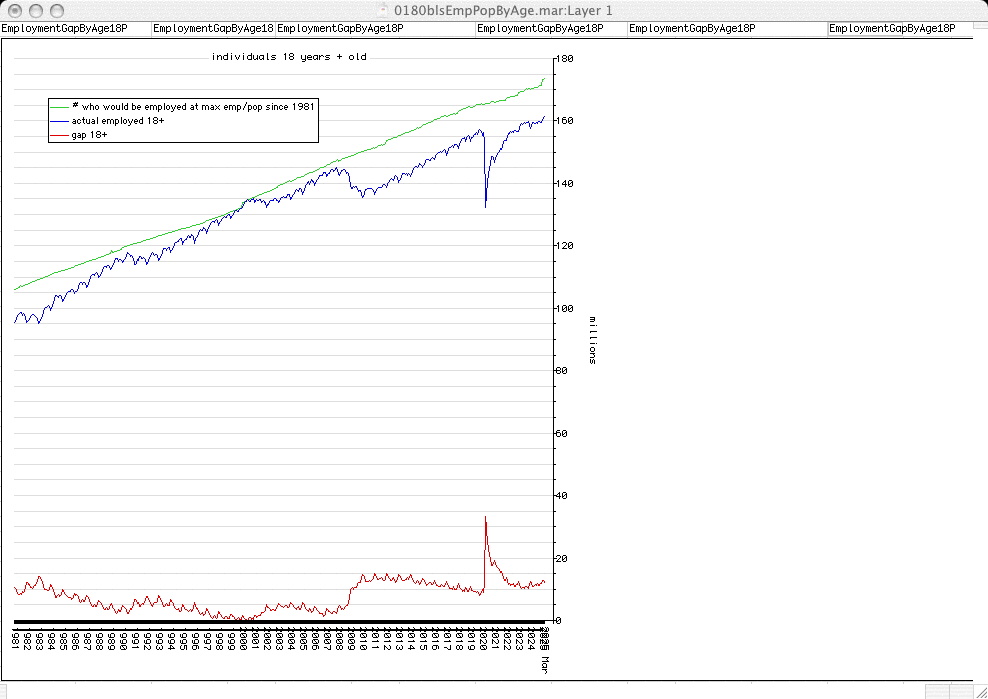
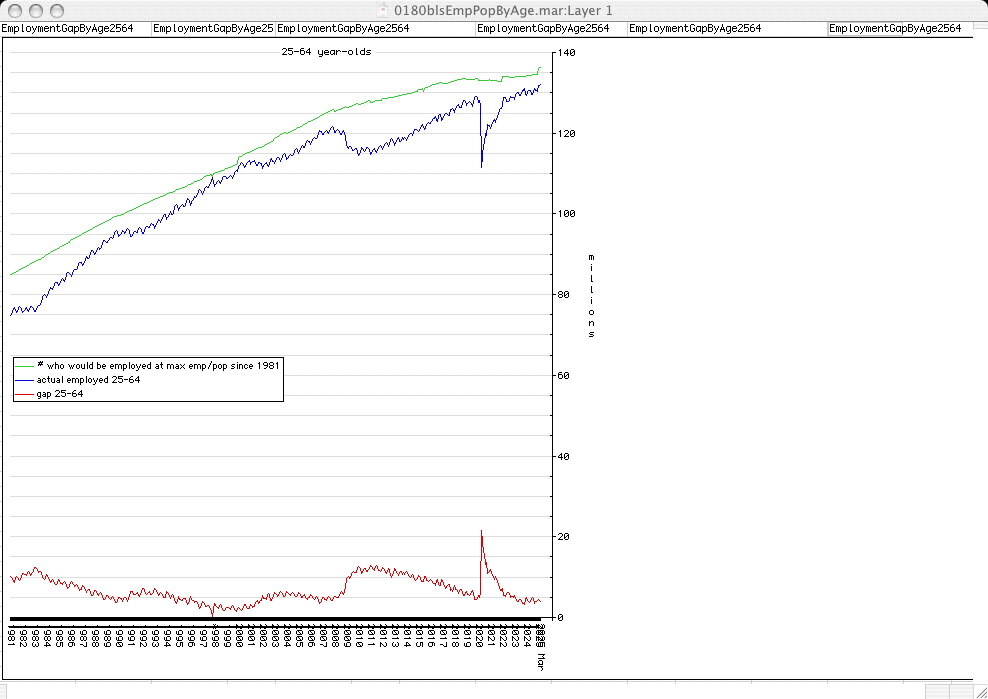
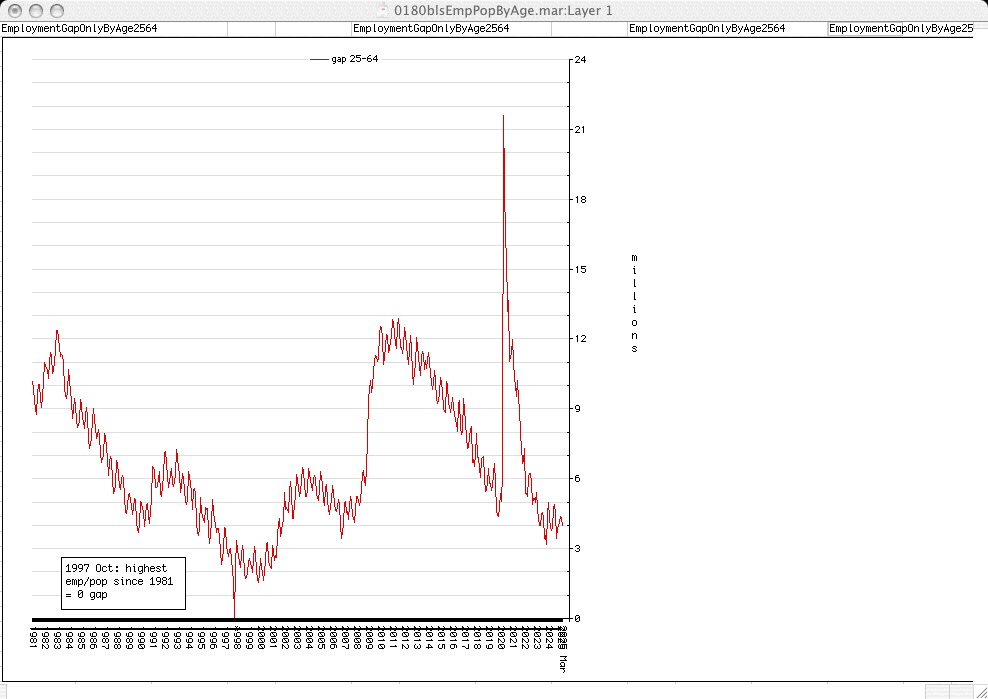
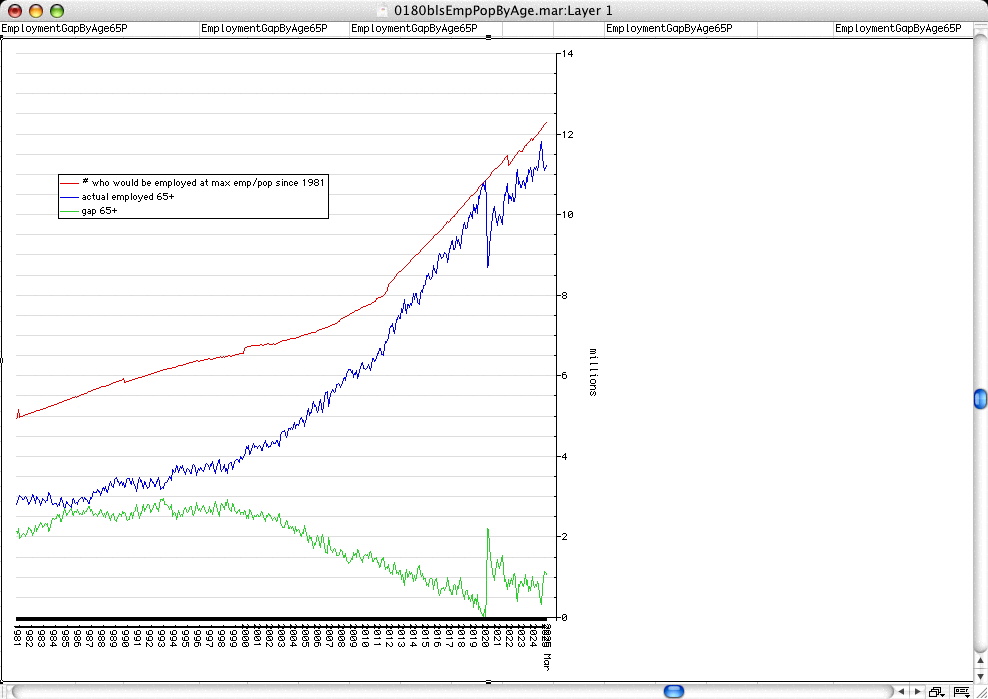
The following 5 "jobs gap" graphs are from data-sub-sets lacking deep enough historical base-line figures to reflect the best full-employment levels of the past. They use data going back only to 1981, rather than the immediate post-WW2 years, when job/employment markets were more robust, let alone pre-Great-Depression years. As a result, they provide a rosier picture than is the reality; the jobs dearth is somewhat worse than they make it appear... in some cases, about twice as bad.
aggregate estimated jobs gap (16-years & older)
aggregate estimated jobs gap only (16-years & older)
aggregate estimated jobs gap (18-years & older)
aggregate estimated jobs gap (25-64 years old)
aggregate estimated jobs gap only (25-64 years old)
aggregate estimated jobs gap (65-years & older)
Detailed Occupational Categories
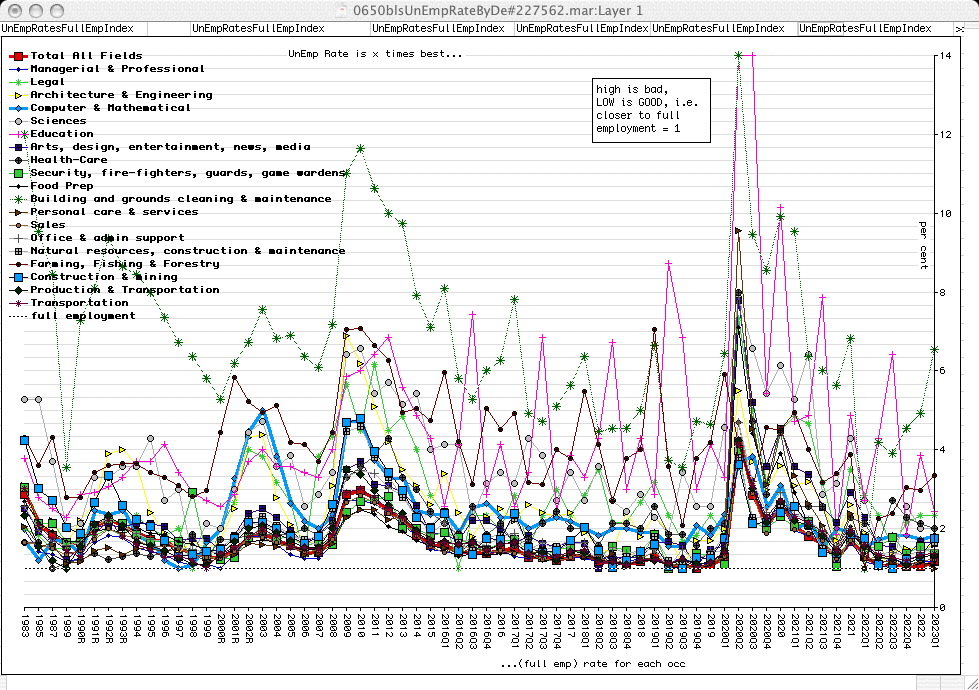
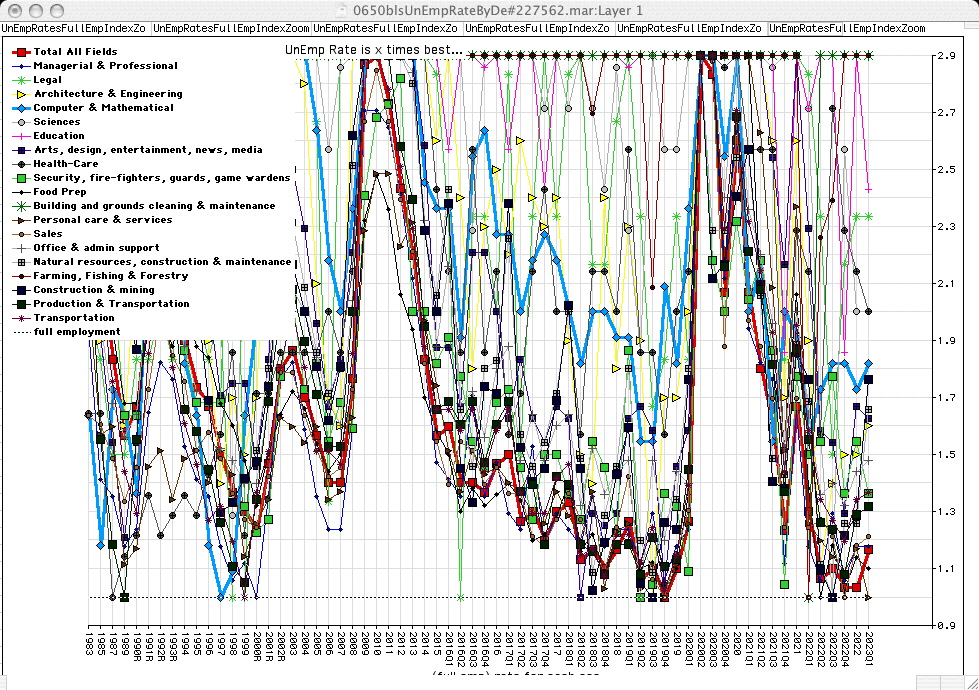
The following 2 graphs are from data-sub-sets lacking deep enough historical figures to reflect the best full-employment levels of the past. They use data going back only to 1984 or later, rather than the immediate post-WW2 years, when job/employment markets were more robust. As a result, they provide a rosier picture than is the reality. These data are also from a sub-sub-sample such that they have a low reliability. There are gaps where the sub-sub-sample is so tiny as to give meaningless results. Figures for occupations with only a few thousand practitioners are especially sketchy, but some of the larger aggregate categories, and most of the annual figures for categories with 70K+ practitioners are a little better.
Full Employment Index by detailed occupation (1 = good, 2+ = very bad)
Full Employment Index by detailed occupation (1 = good, 2+ = very bad; scale 0.9x to 2.9x)
Estimations of Jobs Dearth/Insufficiency/Shortfall/Shortage
🚧 construction zone warning barrier 🚧 experimental 🥽 🥼 🦺 ⚗ 📈
Definitions & Descriptions:
Civilian, non-institutionalized population, 16 years and older (wikipedia)
(ottO .G nhoJ)
| jgo Resume | jgo Reading Room |
| jgo Econ Data | jgo Econ News Bits |
| jgo's Links | |
| jgo's Work in Progress | |
| Kermit's home page | |
| Page Top | |
