Visa Statistics from DHS & the USA State Department
plug: graphs prepared using Mariner Calc
This is me, raising my banners high, seeking people with whom I'd like to work, live, trade, support. All flags flying!
updated: 2024-10-29
Bottom
| |
"Res ipsa loquitur."
(The facts speak for themselves.)
| |
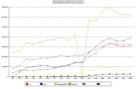
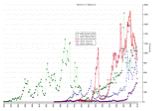
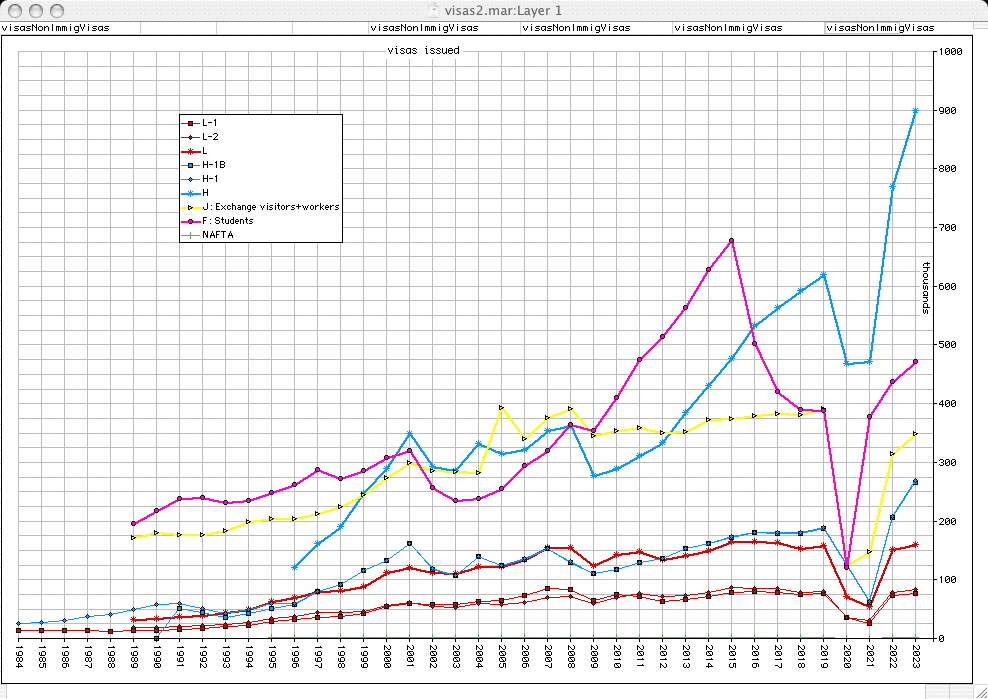
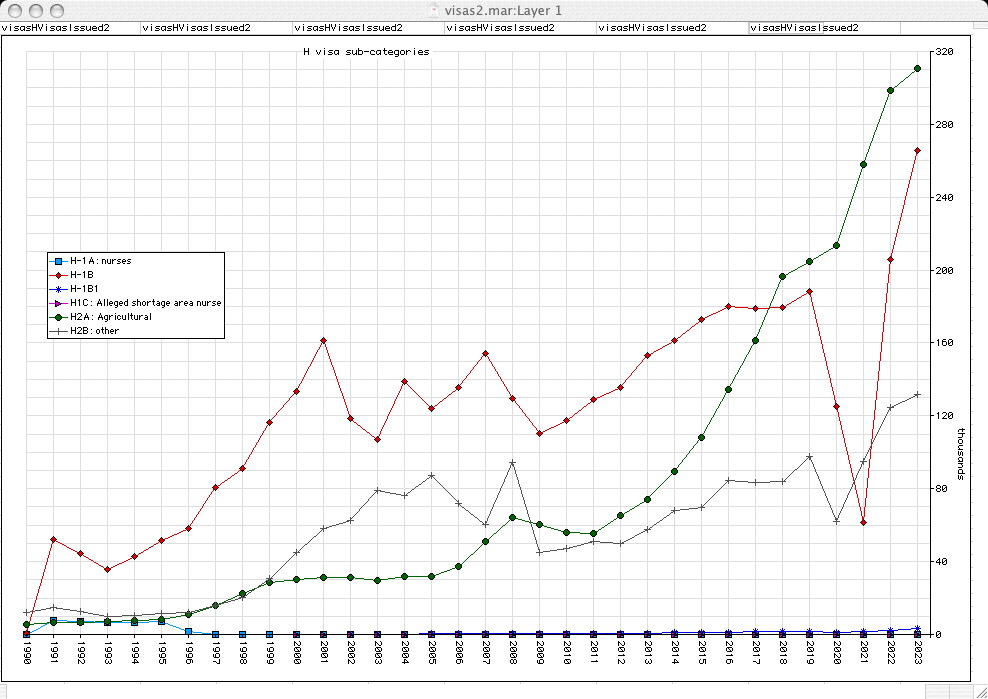
non-immigrant visas by type (F, H, J, L, NAFTA)
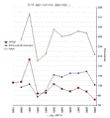
non-immigrant visas by general type
non-immigrant visas by type grouping
non-immigrant visas by type grouping
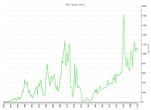
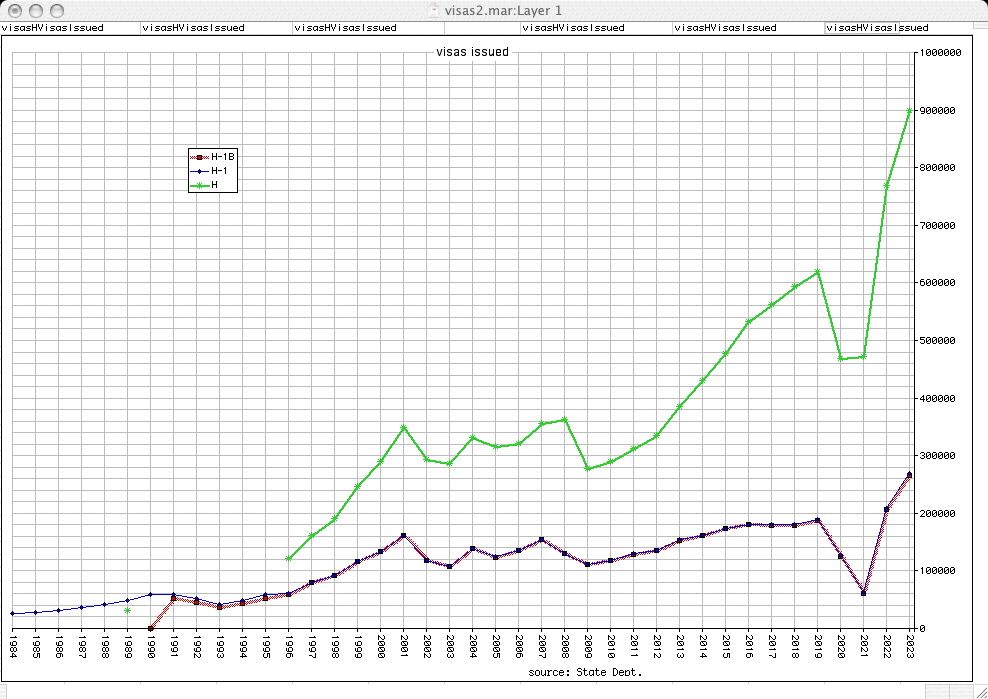
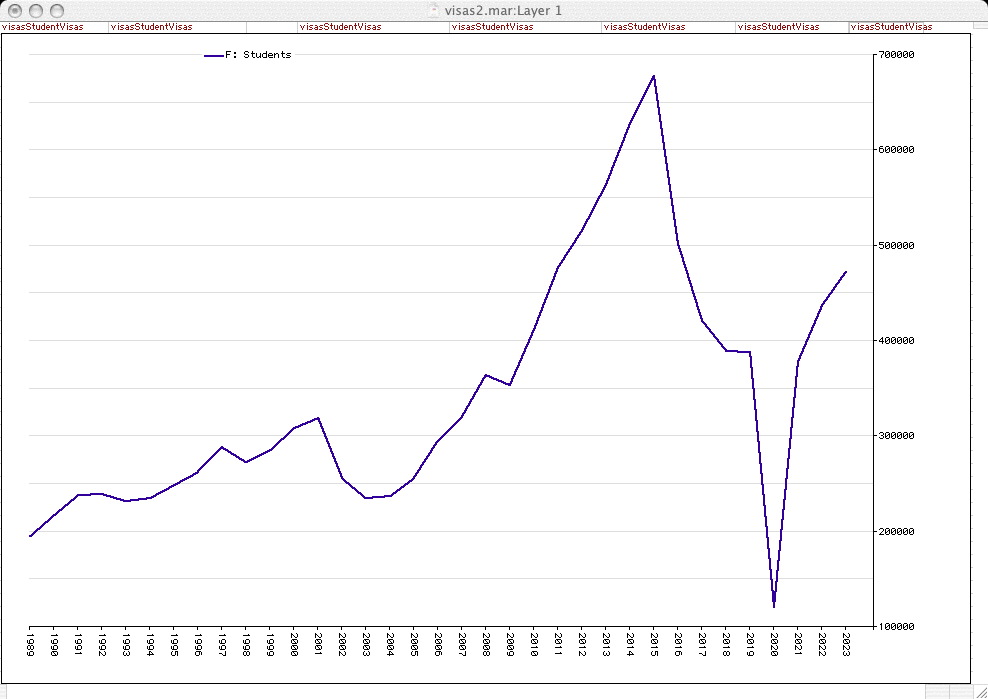
Student visas which feed demand for H visas
Note: These numbers are taken from State Department tables which leave out visas issued after an initial rejection and subsequent successful appeal or waiver. In some cases these amount to tens or hundreds of thousands of additional visas, about a million total non-immigrant visas and 26,802 more H-1B visas in FY2008. This brings the actual total H-1B visas initially issued, renewed and extended in FY2008 up to 156,985.
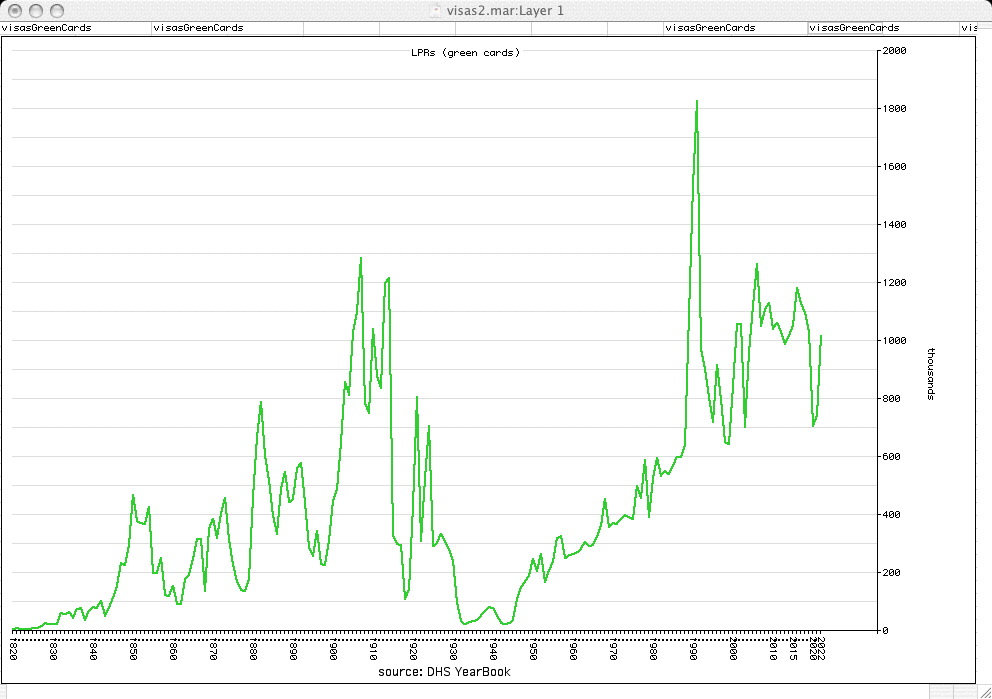
Green Cards (graph from census/DHS report)
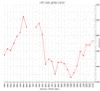
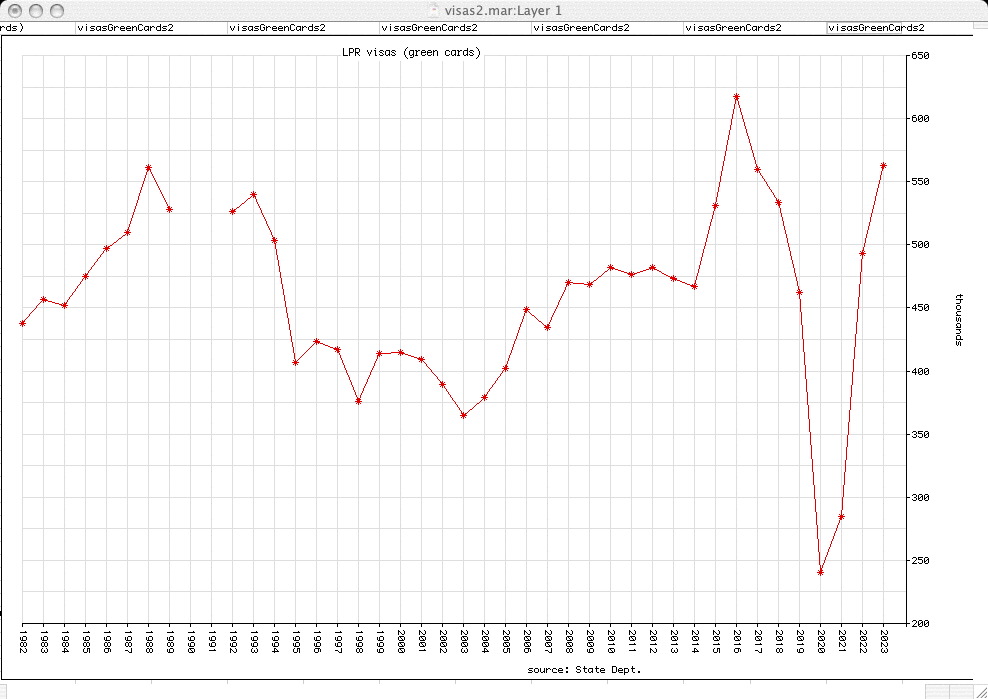
Green Cards 1982- (graph from State Dept. reports)
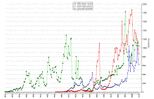
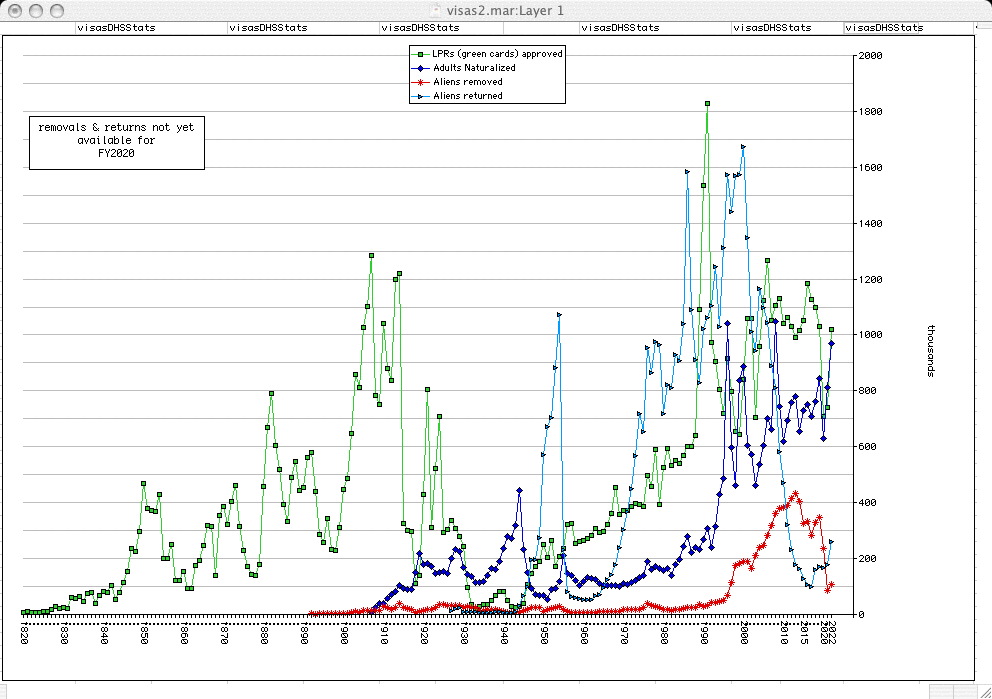
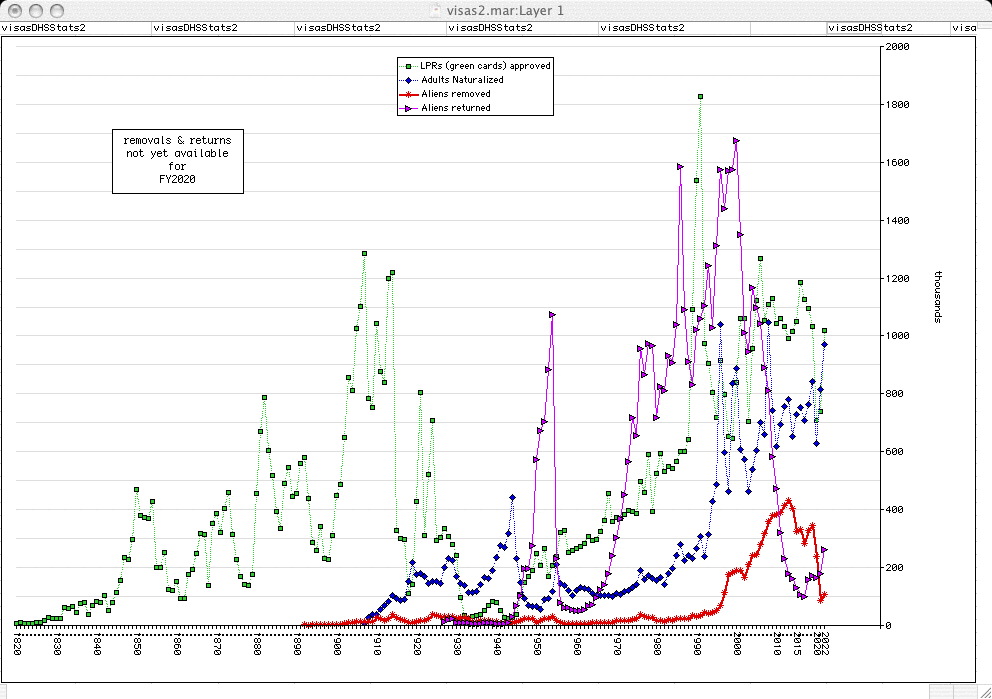
Green Cards, Naturalized Adults, and
Aliens Removed+Returned (from DHS year-book)
Aliens Removed+Returned (from DHS year-book)
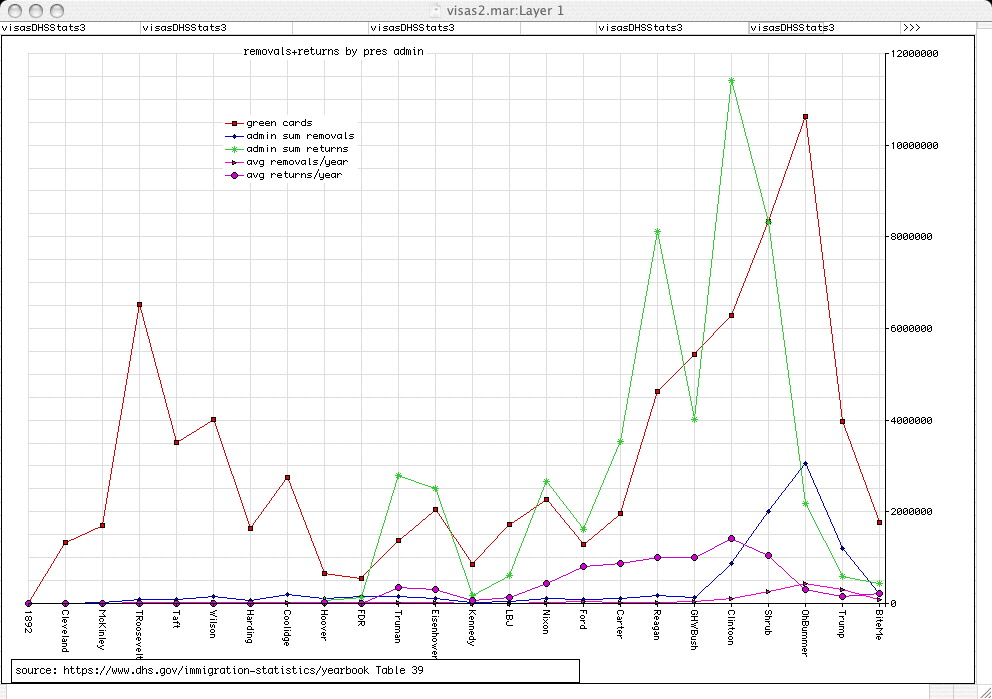
Aliens Removed+Returned by presidential administration (from DHS year-book)
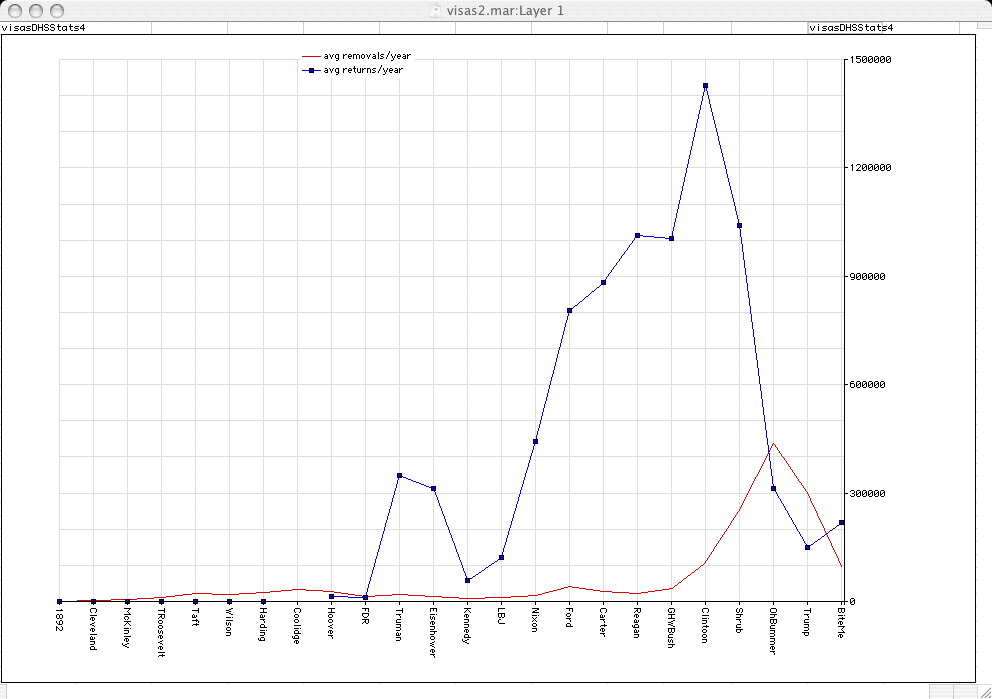
Annual Average Aliens Removed+Returned by presidential administration (from DHS year-book)
DHS Year-Book of Immigration Statistics (2020 returns & removals not yet released 2022-02-02)
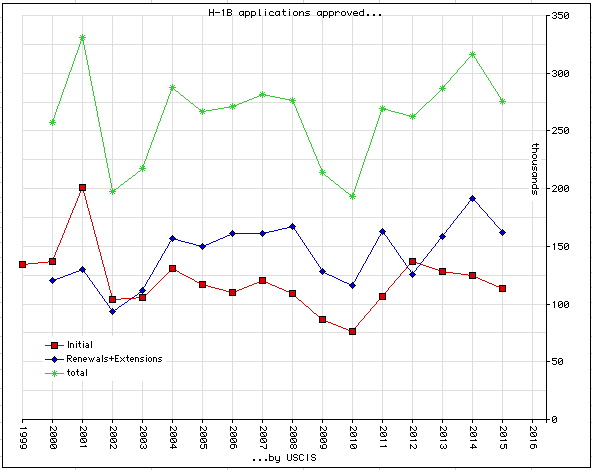
H-1B visa applications approved by USCIS
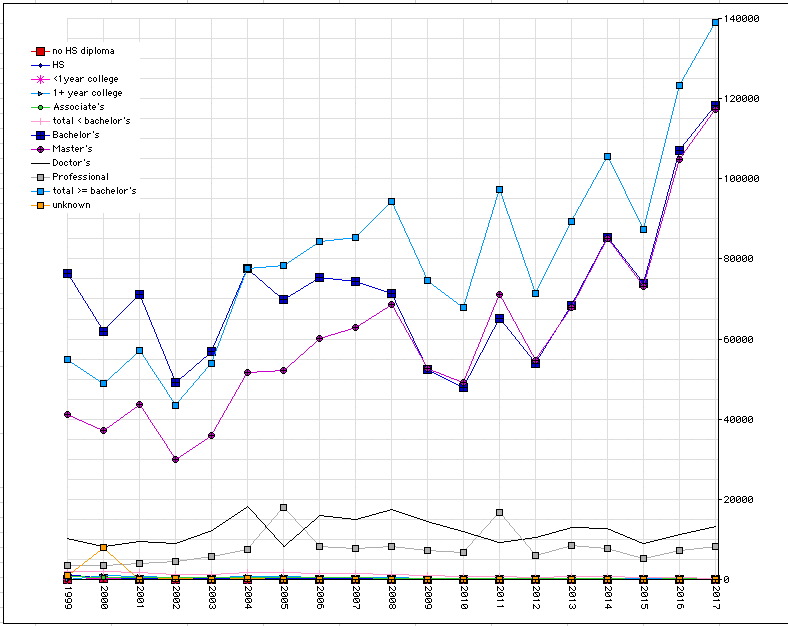
H-1B visa applications approved by USCIS, by highest educational credential earned
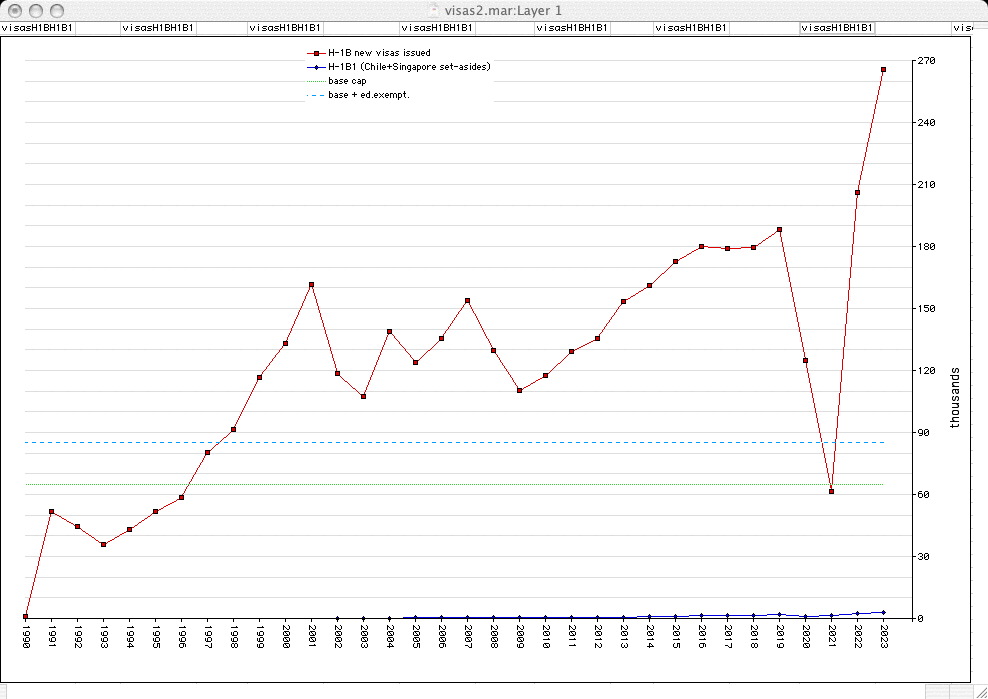
H-1B "caps" & visas approved by USCIS
(not visas issued)
Fiscal
Year |
Base
Cap |
Visas
Approved |
Cut-Off
Date |
Renewals |
|---|
| 1998 | 65K | 84K | none | NA |
| 1999 | 115K | 134,411 | 1999-04-16 | NA |
| 2000 | 115K | 136,787 | 2000-03-21 | 120,853 |
| 2001 | 195K | 201,079 | none | 130,127 |
| 2002 | 195K | 103,584 | none | 93,953 |
| 2003 | 195K | 105,314 | none | 112,026 |
| 2004 | 85K | 130,497 | 2004-02-17 | 156,921 |
| 2005 | 85K | 116,927 | 2004-10-01 | 150,204 |
| 2006 | 85K | 109,614 | | 161,367 |
| 2007 | 85K | 120,031 | | 161,413 |
| 2008 | 85K | 109,335 | | 166,917 |
| 2009 | 85K | 86,300 | | 127,971 |
| 2010 | 85K | 76,627 | | 116,363 |
| 2011 | 85K | 106,445 | | 163,208 |
| 2012 | 85K | 136,890 | | 125,679 |
| 2013 | 85K | 128,291 | | 158,482 |
| 2014 | 85K | 124,326 | | 191,531 |
| 2015 | 85K | 113,603 | | 161,714 |
| 2016 | 85K | 114,503 | | 230,759 |
| 2017 | 85K | 108,101 | | 257,581 |
Fiscal
Year |
Base
Cap |
Visas
Approved |
Cut-Off
Date |
Renewals |
|---|
new H-1B visa applications, USCIS approved, by degree
(not visas issued)
| year |
no HS diploma |
HS |
<1 year college |
1+ year college |
Associate's |
total < bachelor's |
Bachelor's |
Master's |
Doctor's |
Professional |
total > bachelor's |
unknown |
total |
year |
|---|
| 1999 | | | | | | | | | | | | | 134,411 | 1999 |
| 2000 | 554 | 288 | 158 | 1,290 | 696 | 2,986 | 72,196 | 35,990 | 8,782 | 3,013 | 47,785 | 13,820 | 136,787 | 2000 |
| 2001 | 247 | 895 | 284 | 1,376 | 1,181 | 3,983 | 116,558 | 59,357 | 15,121 | 5,772 | 80,250 | 288 | 201,079 | 2001 |
| 2002 | 169 | 806 | 189 | 849 | 642 | 2,655 | 50,332 | 30,119 | 14,220 | 6,112 | 50,451 | 146 | 103,584 | 2002 |
| 2003 | 148 | 822 | 122 | 623 | 534 | 2,249 | 51,141 | 30,612 | 14,448 | 6,771 | 51,831 | 93 | 105,314 | 2003 |
| 2004 | 123 | 690 | 137 | 421 | 432 | 1,803 | 62,163 | 45,707 | 14,006 | 6,663 | 66,376 | 155 | 130,497 | 2004 |
| 2005 | 107 | 440 | 77 | 358 | 363 | 1,345 | 49,604 | 45,890 | 5,883 | 14,097 | 65,870 | 108 | 116,927 | 2005 |
| 2006 | 96 | 392 | 54 | 195 | 177 | 914 | 46,501 | 44,474 | 12,543 | 5,155 | 62,172 | 27 | 109,614 | 2006 |
| 2007 | 72 | 374 | 42 | 210 | 215 | 913 | 49,244 | 50,914 | 13,469 | 5,482 | 69,865 | 9 | 120,031 | 2007 |
| 2008 | 80 | 174 | 19 | 175 | 195 | 643 | 47,613 | 43,441 | 12,698 | 4,931 | 61,070 | 9 | 109,335 | 2008 |
| 2009 | 108 | 190 | 33 | 236 | 262 | 829 | 35,142 | 32,799 | 12,478 | 5,046 | 50,323 | 6 | 86,300 | 2009 |
| 2010 | 140 | 201 | 24 | 213 | 161 | 739 | 34,153 | 26,676 | 10,422 | 4,632 | 41,730 | 5 | 76,627 | 2010 |
| 2011 | 373 | 500 | 44 | 255 | 170 | 1,342 | 46,549 | 41,310 | 4,892 | 12,323 | 58,525 | 29 | 106,445 | 2011 |
| 2012 | 108 | 220 | 35 | 259 | 174 | 796 | 67,728 | 52,331 | 11,465 | 4,551 | 68,347 | 19 | 125,679 | 2012 |
| 2013 | 68 | 148 | 15 | 162 | 121 | 514 | 60,731 | 50,477 | 12,241 | 4,312 | 67,030 | 16 | 128,291 | 2013 |
| 2014 | 32 | 133 | 18 | 133 | 88 | 404 | 56,843 | 51,058 | 11,839 | 4,170 | 67,067 | 12 | 124,326 | 2014 |
| 2015 | 25 | 69 | 12 | 89 | 72 | 267 | 49,265 | 48,317 | 11,722 | 4,018 | 64,057 | 14 | 113,603 | 2015 |
| 2016 | 25 | 52 | 10 | 75 | 62 | 224 | 45,399 | 52,002 | 12,775 | 4,087 | 68,864 | 16 | 114,503 | 2016 |
| 2017 | 15 | 50 | 3 | 57 | 46 | 171 | 46,937 | 45,405 | 11,704 | 3,870 | 60,979 | 14 | 108,101 | 2017 |
| year |
no HS diploma |
HS |
<1 year college |
1+ year college |
Associate's |
total < bachelor's |
Bachelor's |
Master's |
Doctor's |
Professional |
total > bachelor's |
unknown |
total |
year |
|---|
Sources:
Characteristics of Specialty Occupation Workers 2000 (pdf)
Characteristics of Specialty Occupation Workers 2001 (pdf)
Characteristics of Specialty Occupation Workers 2002 (pdf)
Characteristics of Specialty Occupation Workers 2003 (pdf)
FY2004 Characteristics (pdf)
H-1B 2005 annual report (pdf)
FY2005 Characteristics (pdf)
FY2006 Characteristics (pdf)
FY2007 Characteristics (pdf)
FY2008 Characteristics (pdf)
FY2009 Characteristics (pdf)
FY2010 Characteristics (pdf)
FY2011 Characteristics (pdf)
USCIS reports & studies
State Department reports:
DoS
FY2004-2008 pdf
FY2006 table 16A pdf, table 16B pdf
FY2007 table 16A pdf, table 16B pdf
FY2008 table16A pdf, table 16B pdf
FY2009 table 16A pdf, table 16B pdf
FY2010 table 16A pdf, table 16B pdf
FY2011 Annual Report
FY2012 Annual Report
FY2013 Annual Report
FY2013 NIV Workload by Visa Category (pdf)
FY2014 Annual Report
FY2014 NIV Workload by Visa Category (pdf)
- Rather than admit to an excess, 19K visas issued in FY1998 were counted against FY1999.
- Rather than admit to an excess, some visas issued in FY2000 were counted against FY2001.
- For FY2004, 63K visas were approved of those received before the 2004-02-17 cut-off; later, 2K cases received between 2004 April 1 and 2004 September 30, submitted for FY2005, were rolled back and allocated against FY2004.
- 6,100 unused H-1B1 visas from FY2006 were rolled over (added to) the total for FY2007
Additional sources:
DHS, Office of Inspector General report (pdf)
alternate link
Over-Population Clocks (US census bureau)
US Over-Population Clock detail (US census bureau)
Immigration Clocks
e-mail jgo
(ottO .G nhoJ)
External links may expire at any time.
Neither this page, nor the opinions expressed or implied in it are endorsed by Michael Badnarik, Ron Paul, Binyamin L. Jolkovsky, Bob Barr, Walter E. Williams, Wayne Allyn Root, Thomas Sowell, Warner Brothers, Gary Johnson, Peter Brimelow, president Donald Trump, nor by my hosts, Kermit and Rateliff.
Page Top

