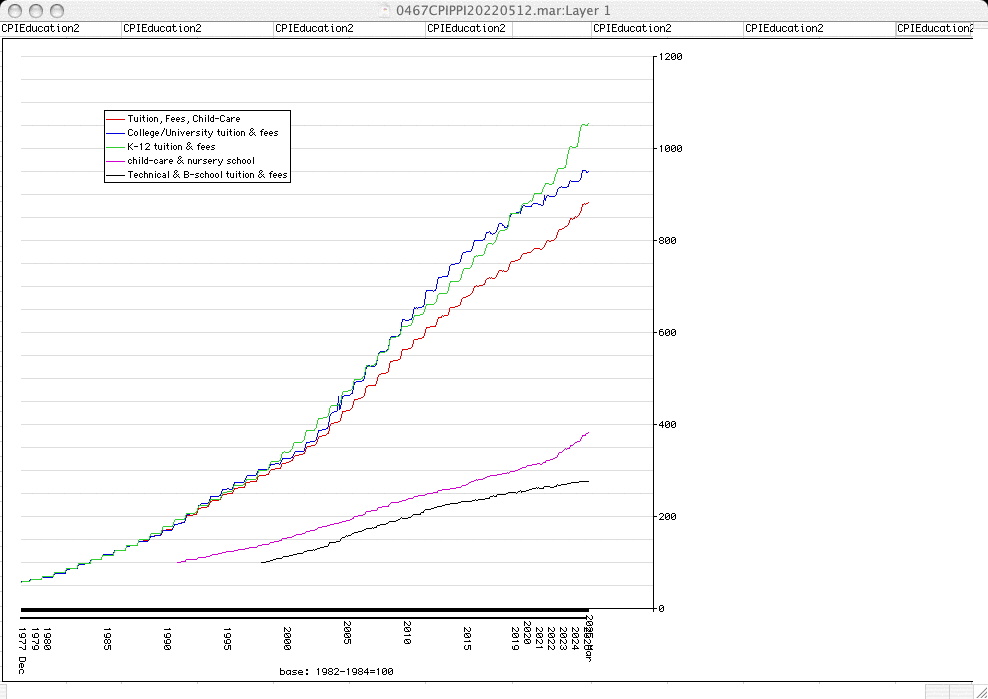
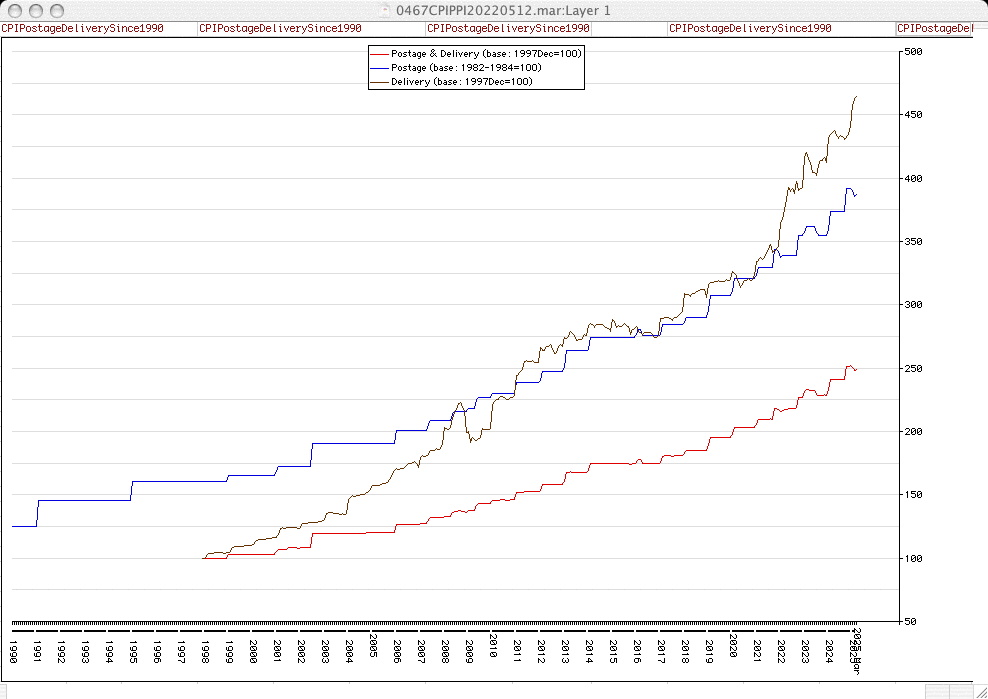
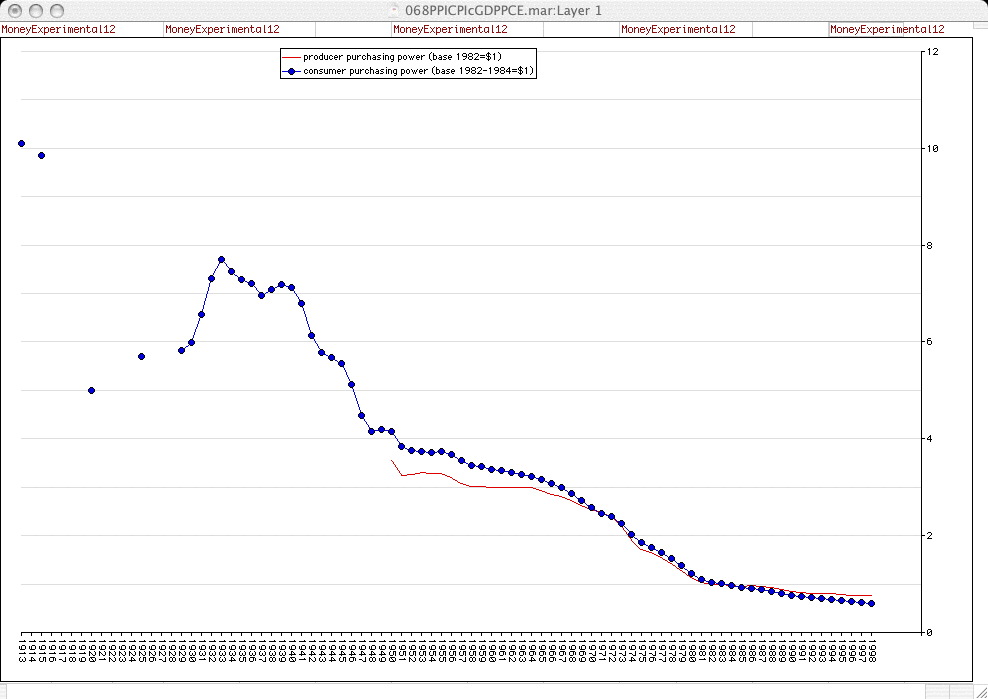
Summary: Price Inflation -- both producer prices & consumer prices, from Apples to Blueberries to Books to Boots to Bread to Butter to Eggs to Electricity to Fuel to Machine-Tools to Medical-Care to Medicines to Orange Juice to Peanut Butter to Shoes to Transporation -- continues to soar.
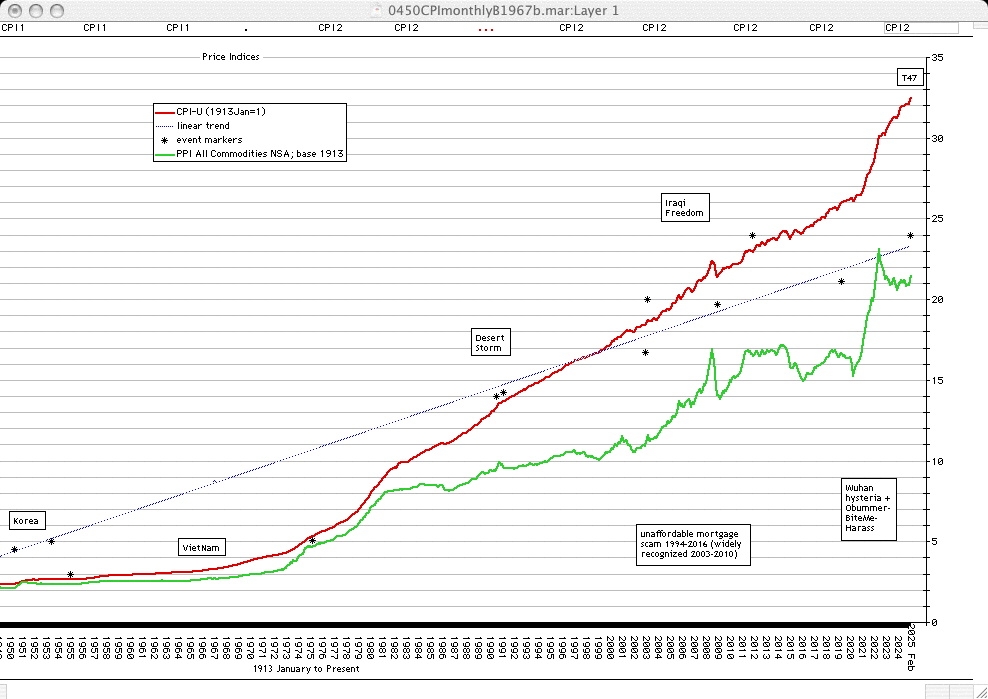
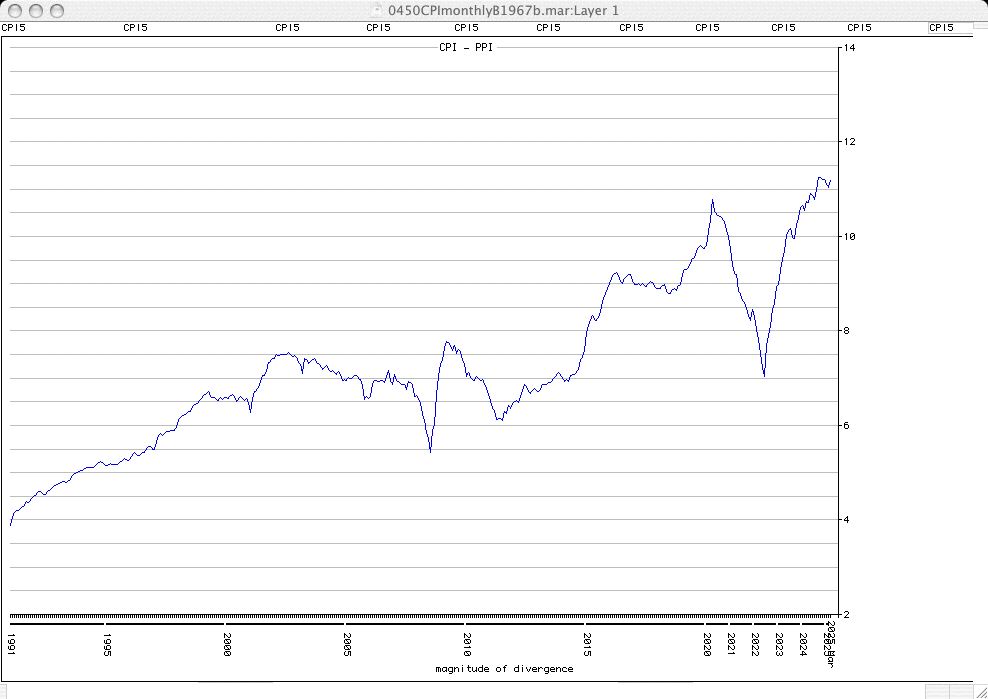
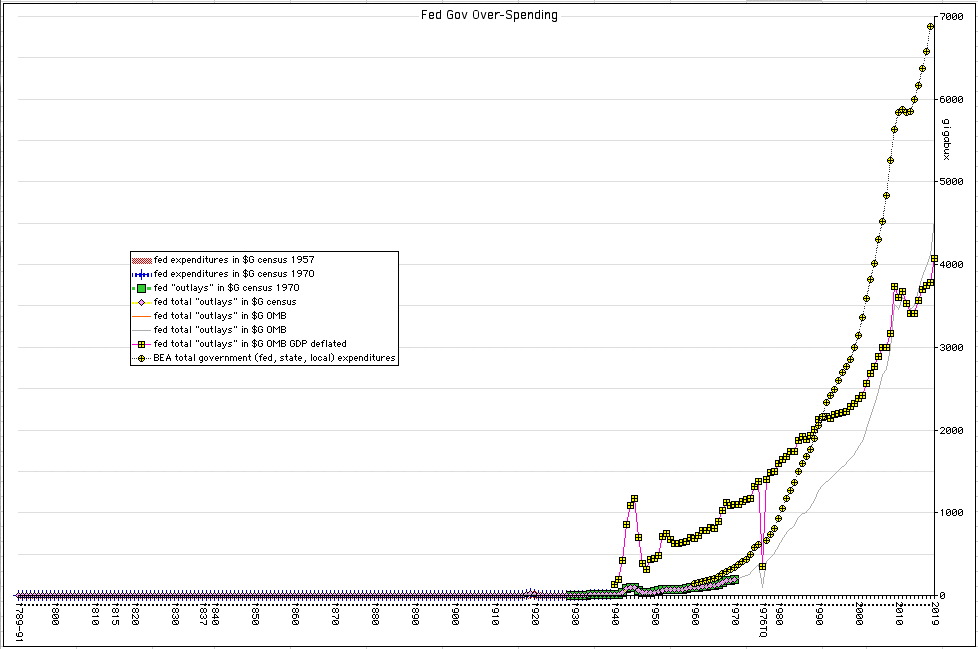
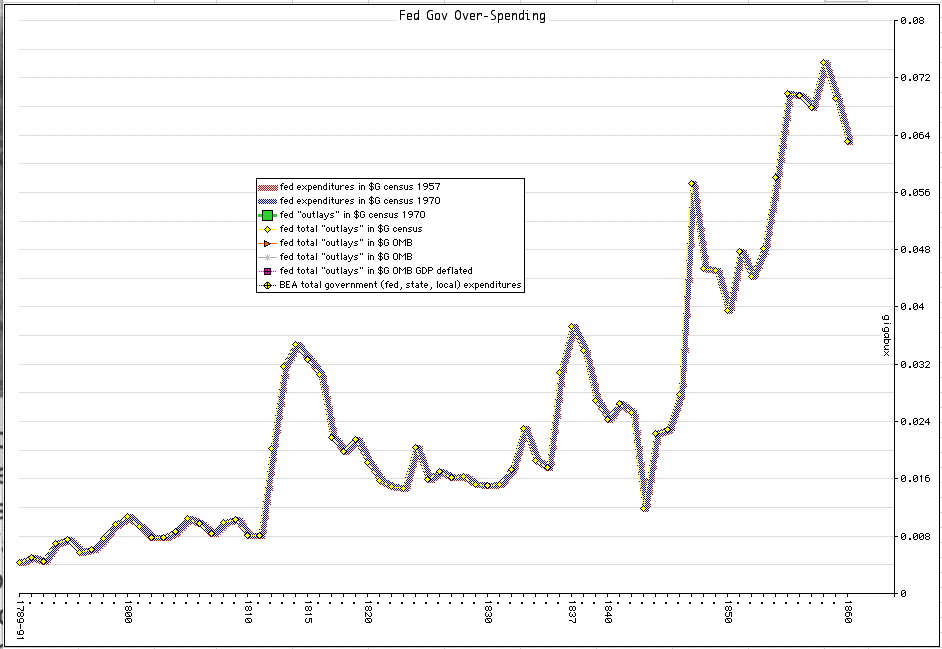
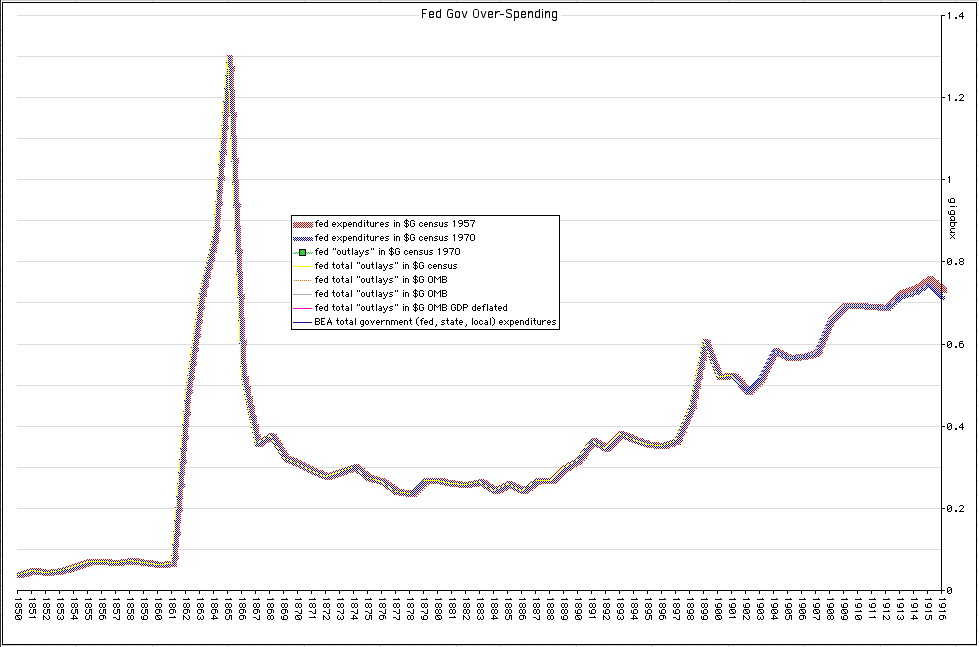
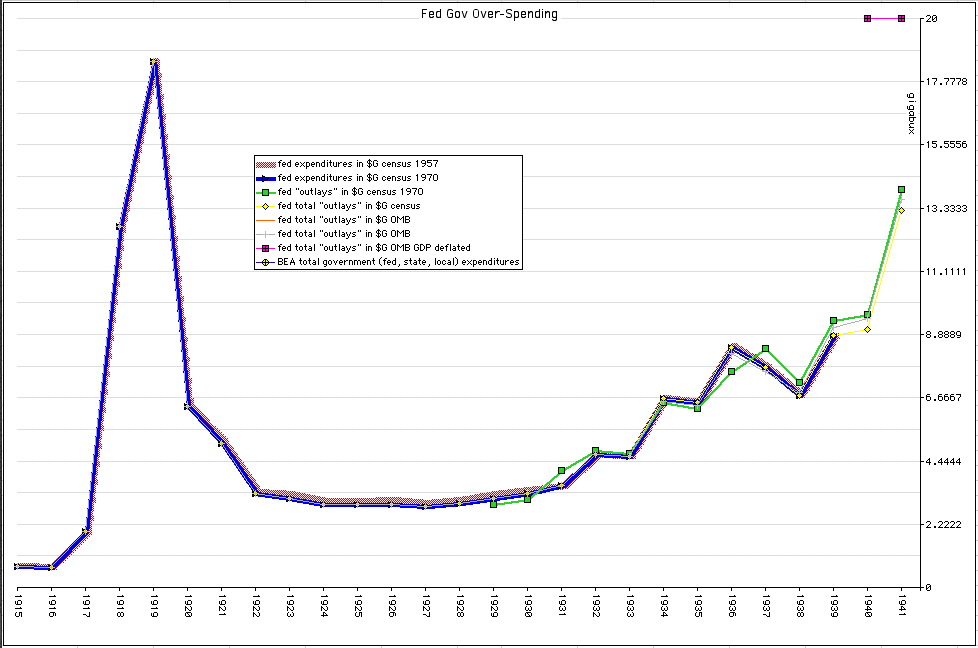
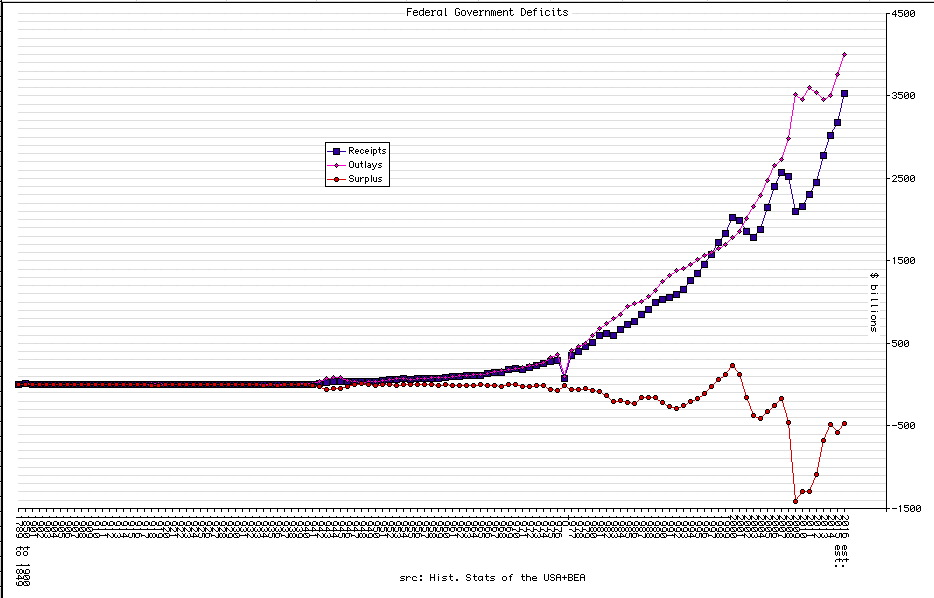
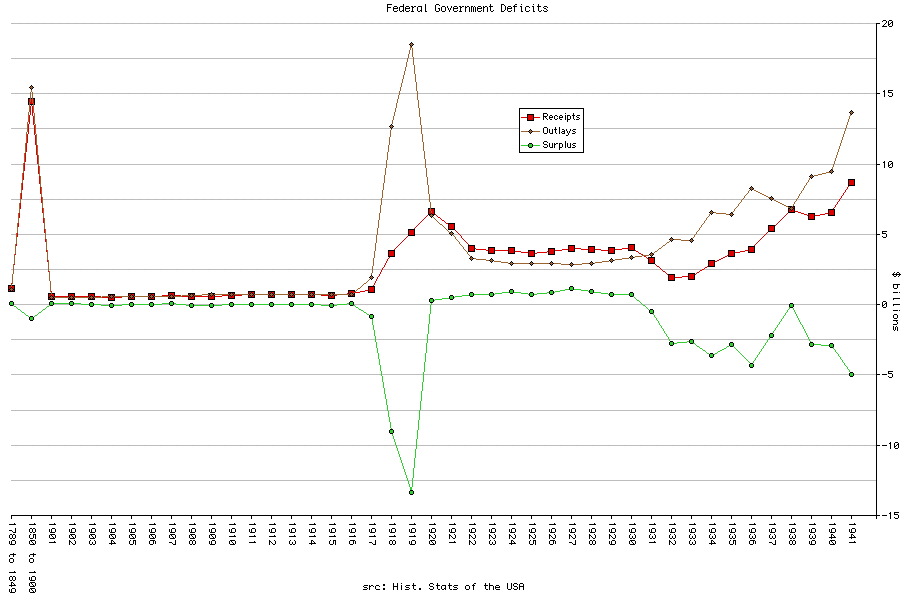
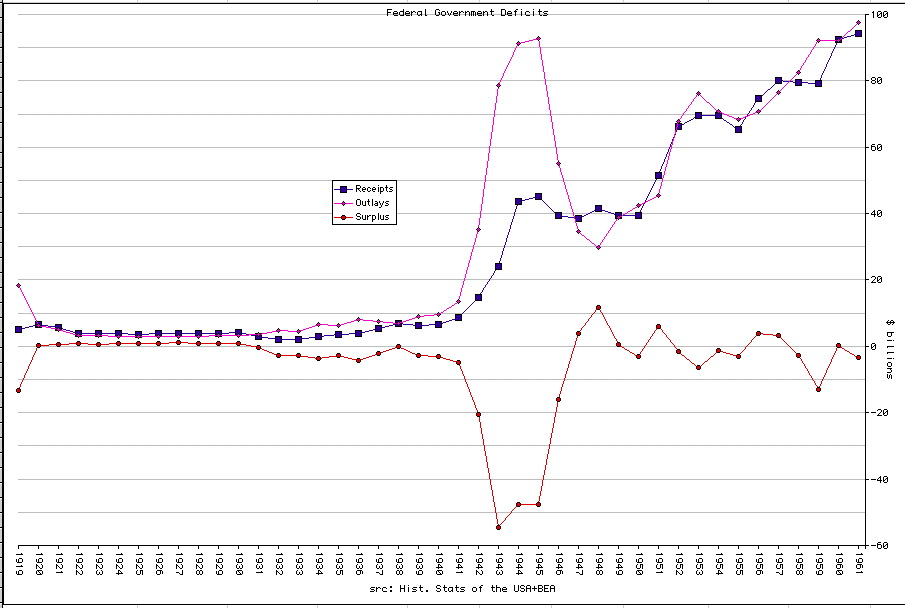
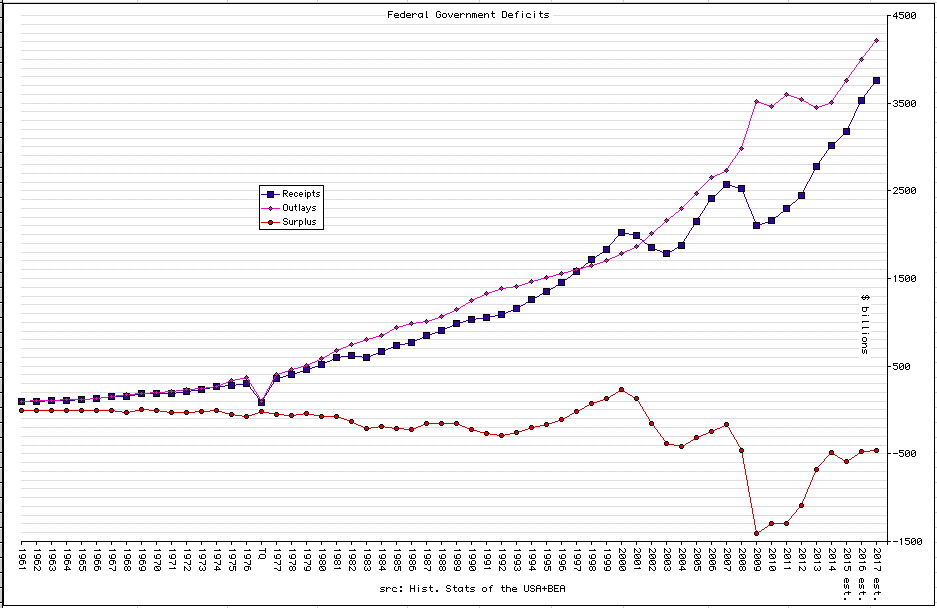
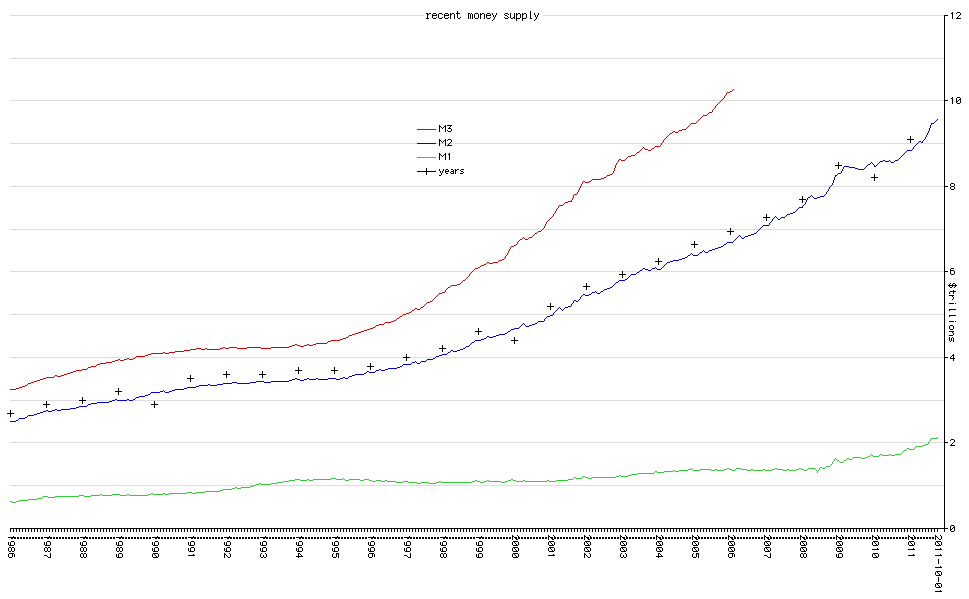
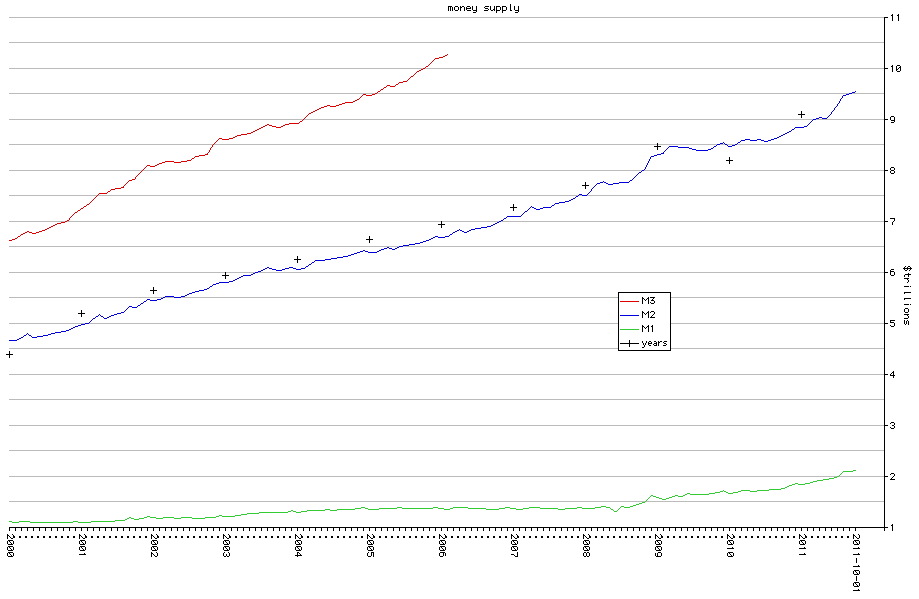
If a curve is higher on the right (at a later date) than it was on the left (earlier date) it is showing that there has been inflation.
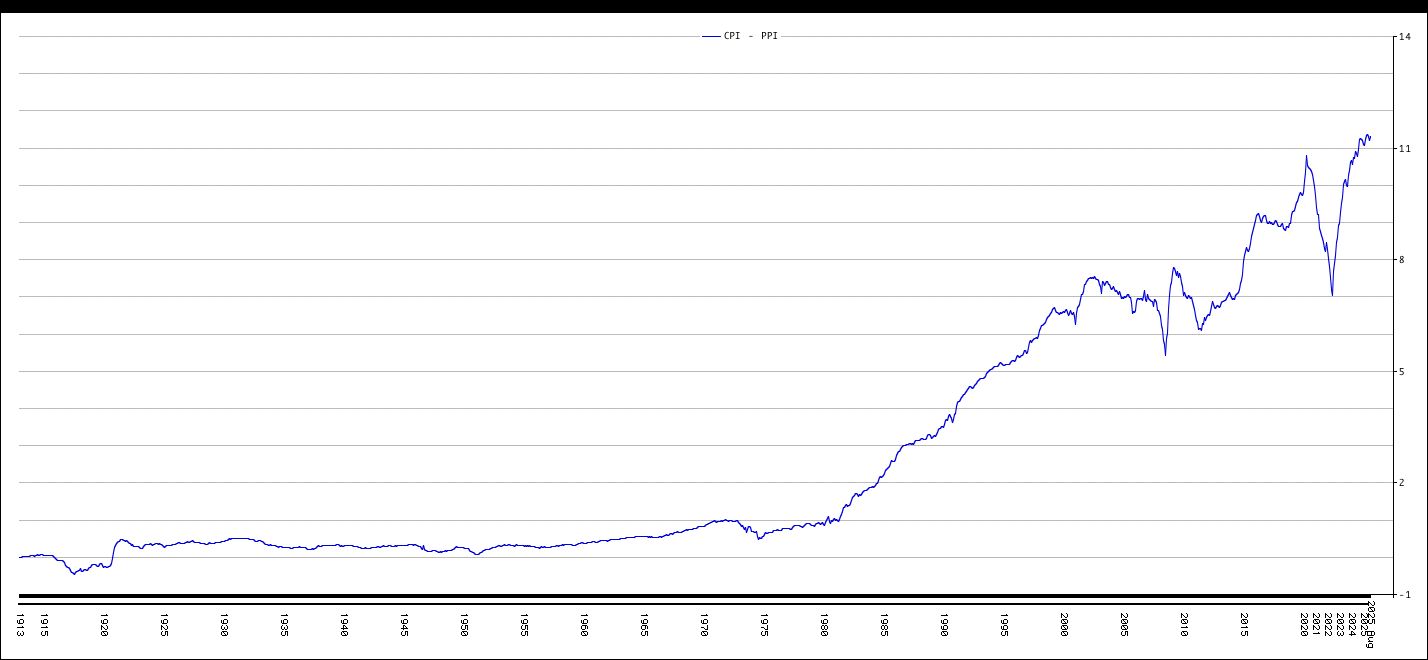
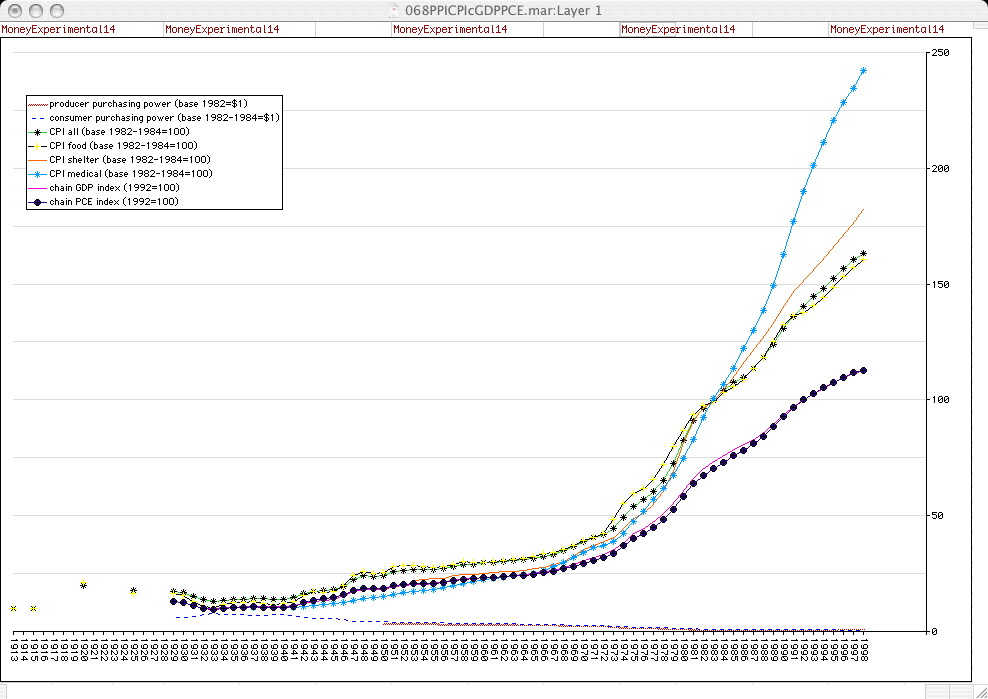
CPI - PPI divergence
The above are based on BLS LabStat series IDs:
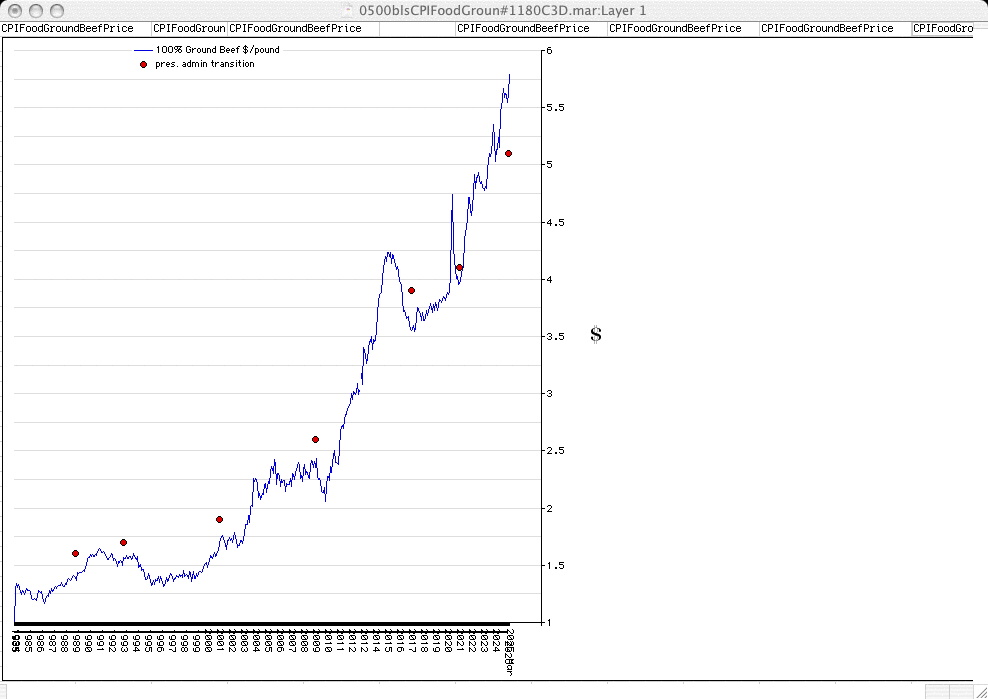
Patriot Post: guess when price inflation suddenly worsened
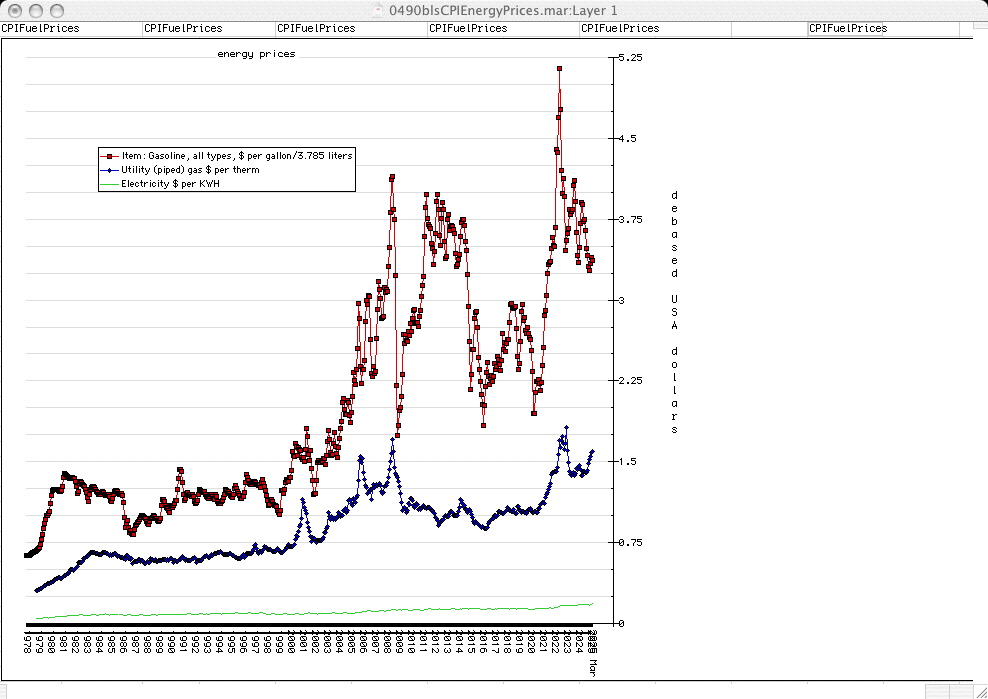
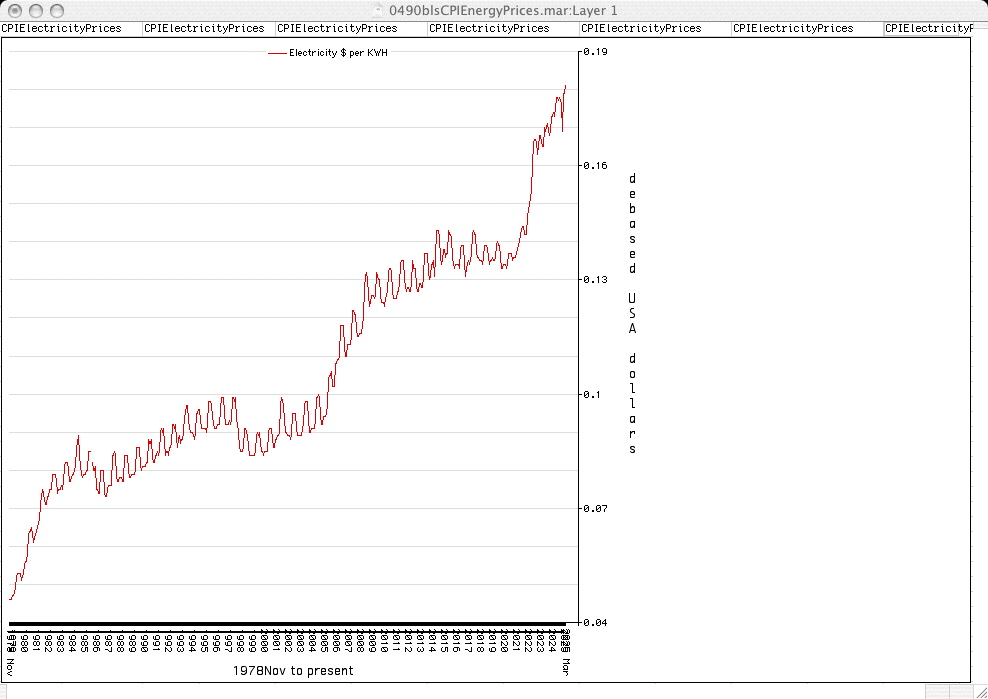
Consumer Energy/Fuel Prices
Electricity Prices ($0.046 per KWh in 1978; about $0.086 per KWh in 2000; $0.134 per KWh in 2016 & 2020; $0.168 per KWh in 2023 January & February)
Food
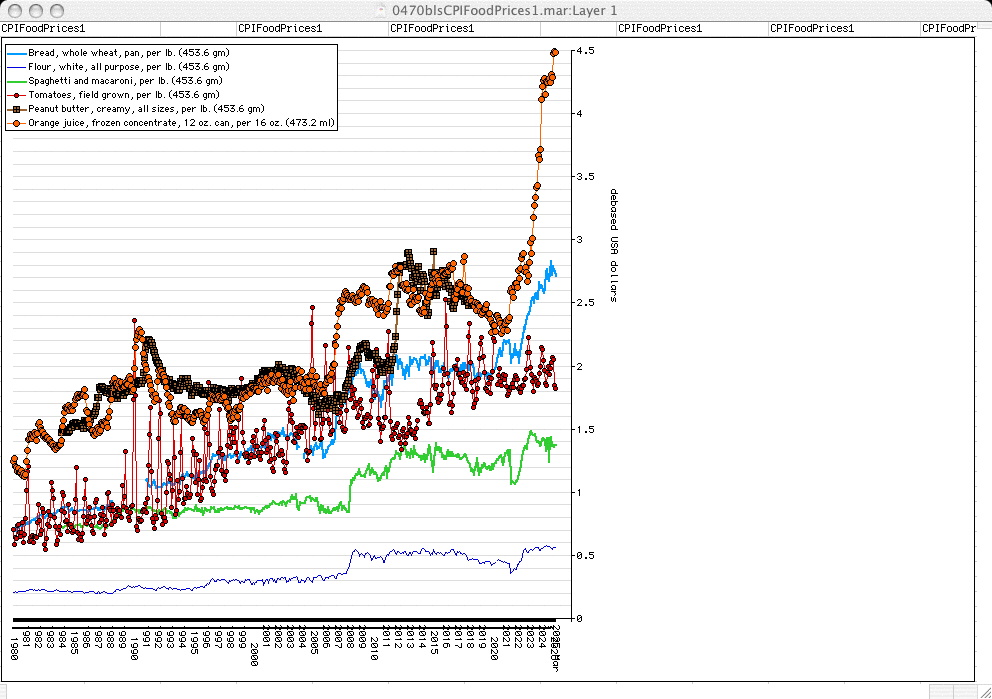
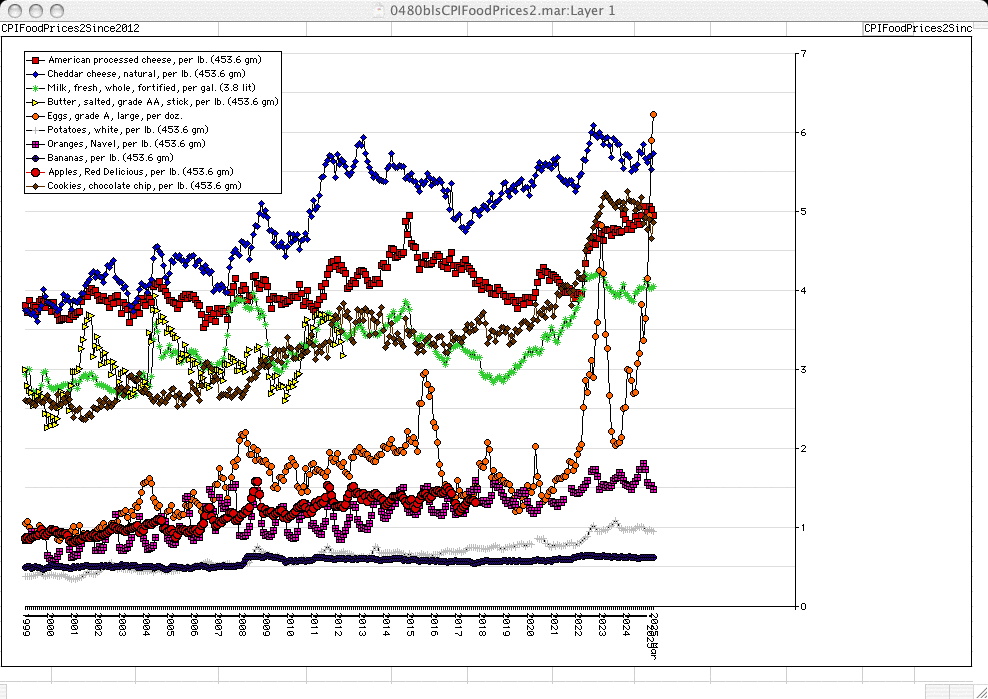
Consumer Food Prices (group 1)
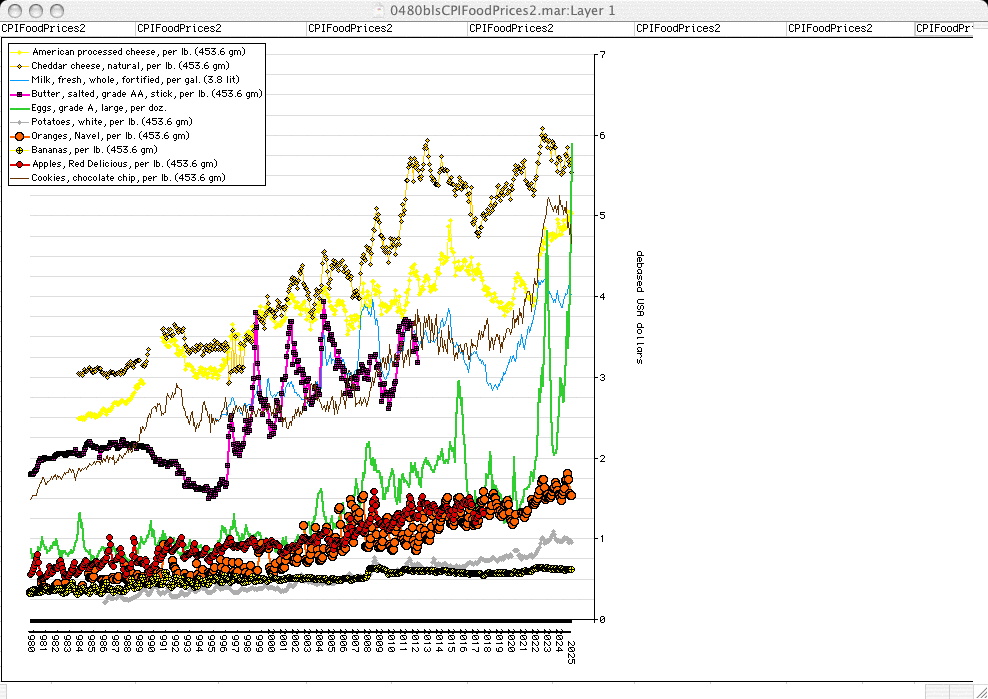
Consumer Food Prices (group 2)
Consumer Food Prices (group 2 since 2012)
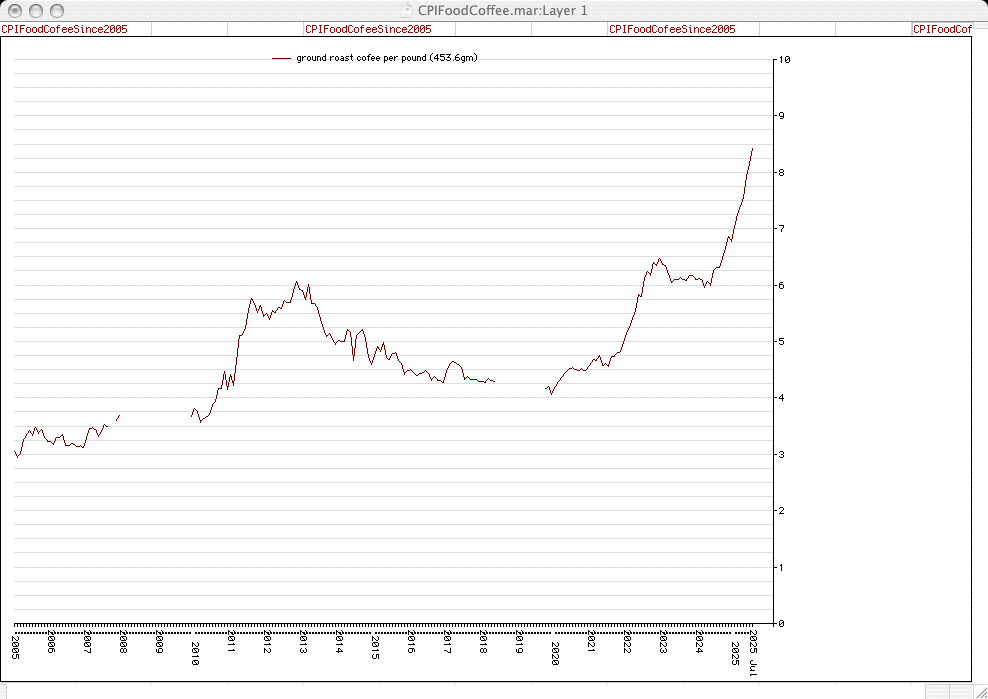
food: coffee retail price per pound of ground roasted, USA city average
Consumer Prices Food Coffee since 1980
Consumer Prices Food Coffee since 2005
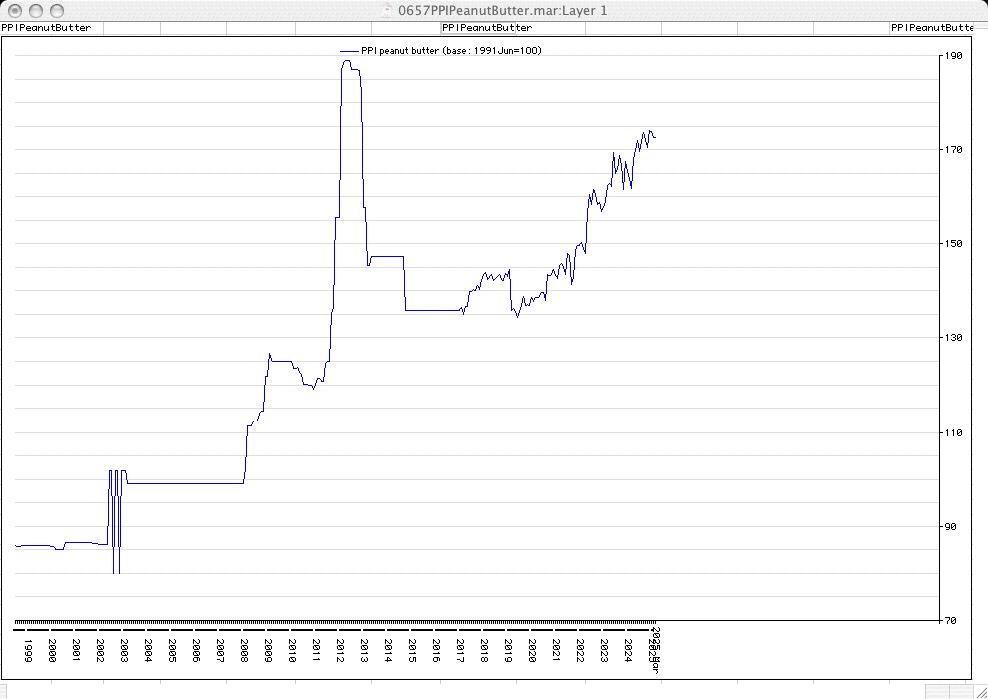
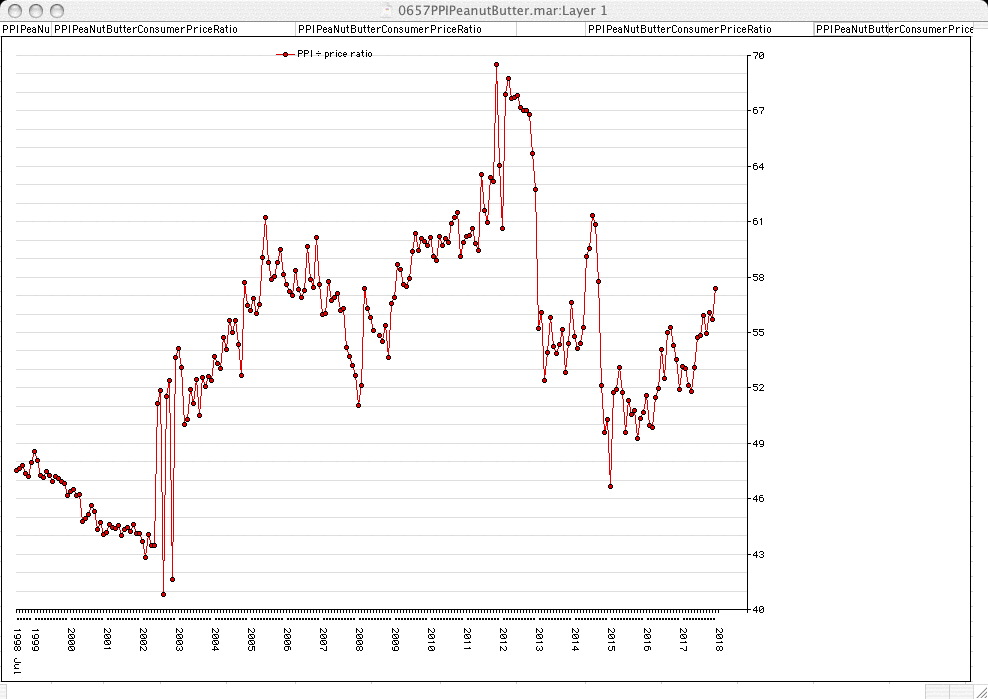
food: peanut butter
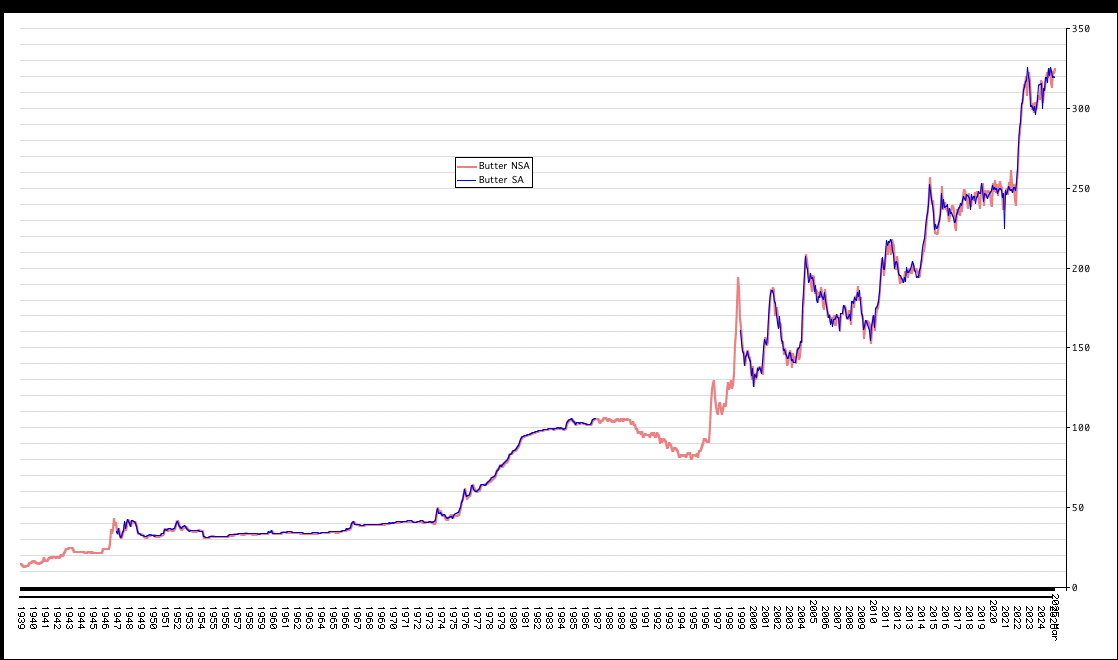
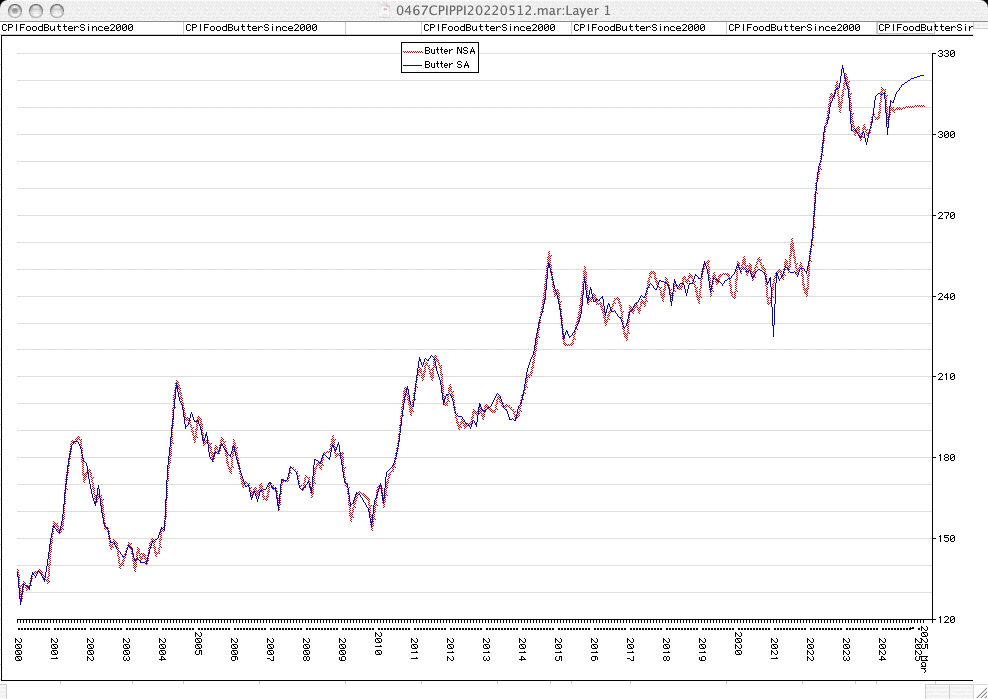
Consumer Price Index Butter 🧈 (base: 1982-1984=100)
retrieved via https://data.bls.gov/series-report BLS data retrieval tool 🧰
Consumer price index Meats, Poultry, Fish & Eggs Price
Consumer price index Meats, Poultry, Fish & Eggs Price since 2000
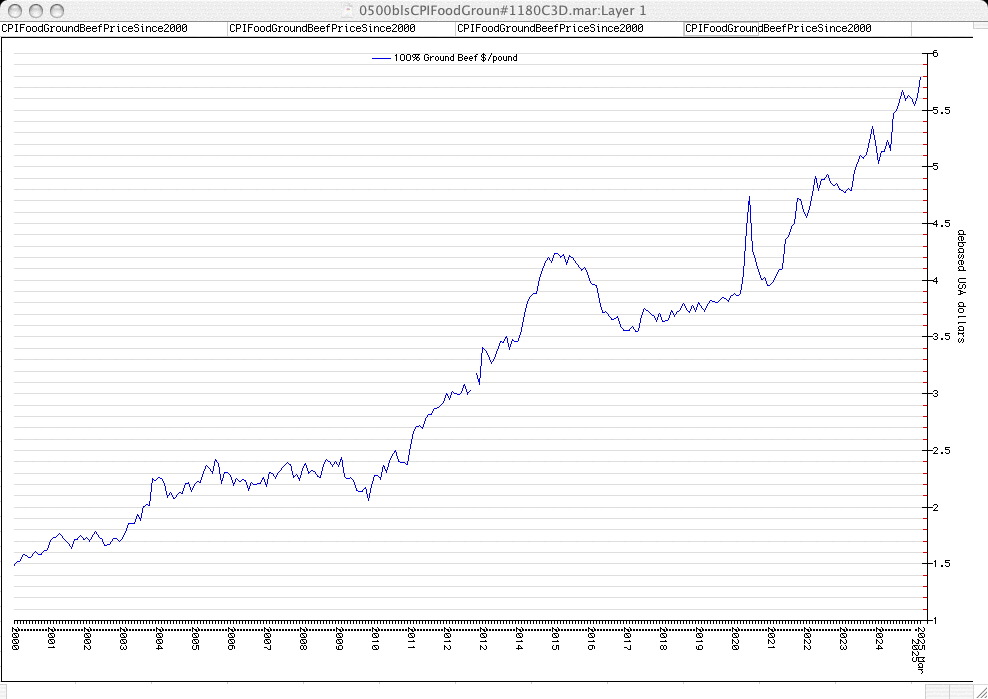
Consumer prices Ground Beef Price 🍔
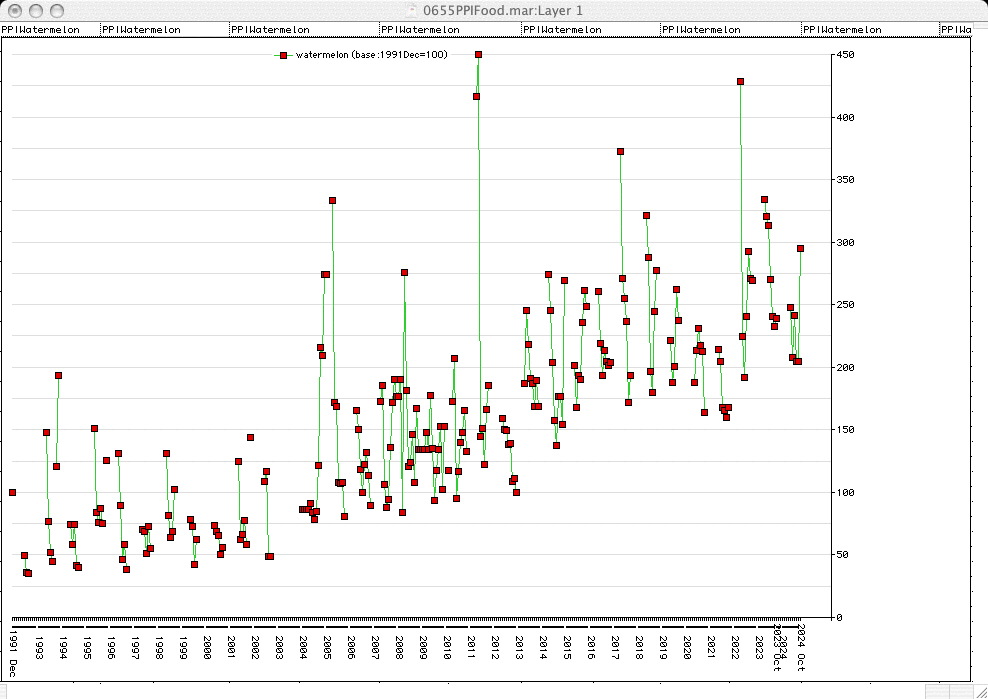
producer price index for Watermelon
retrieved via https://data.bls.gov/series-report BLS data retrieval tool 🧰
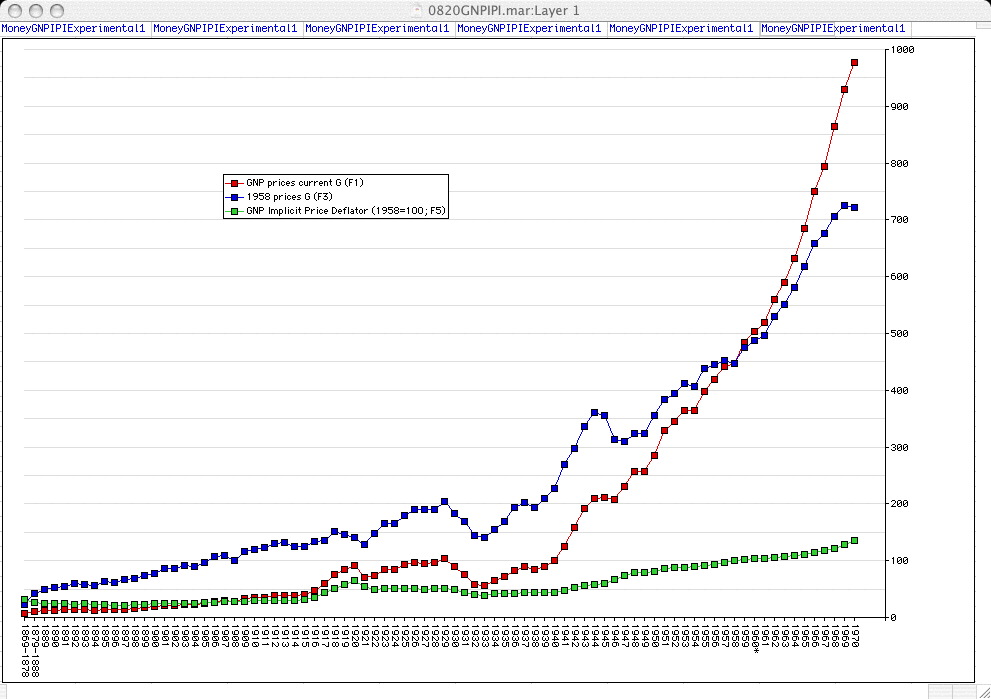
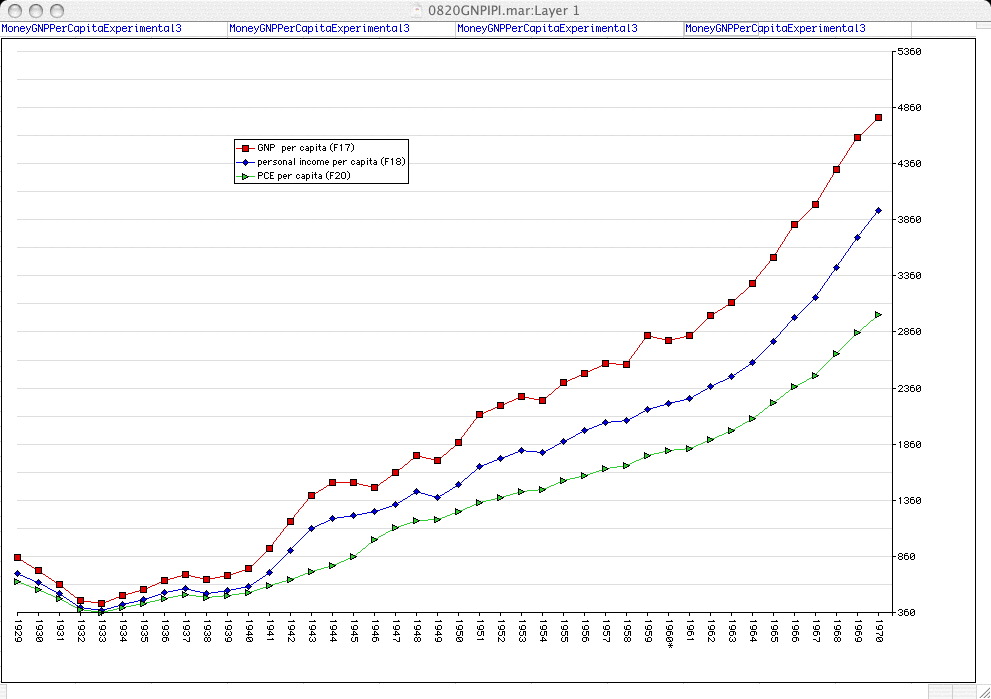
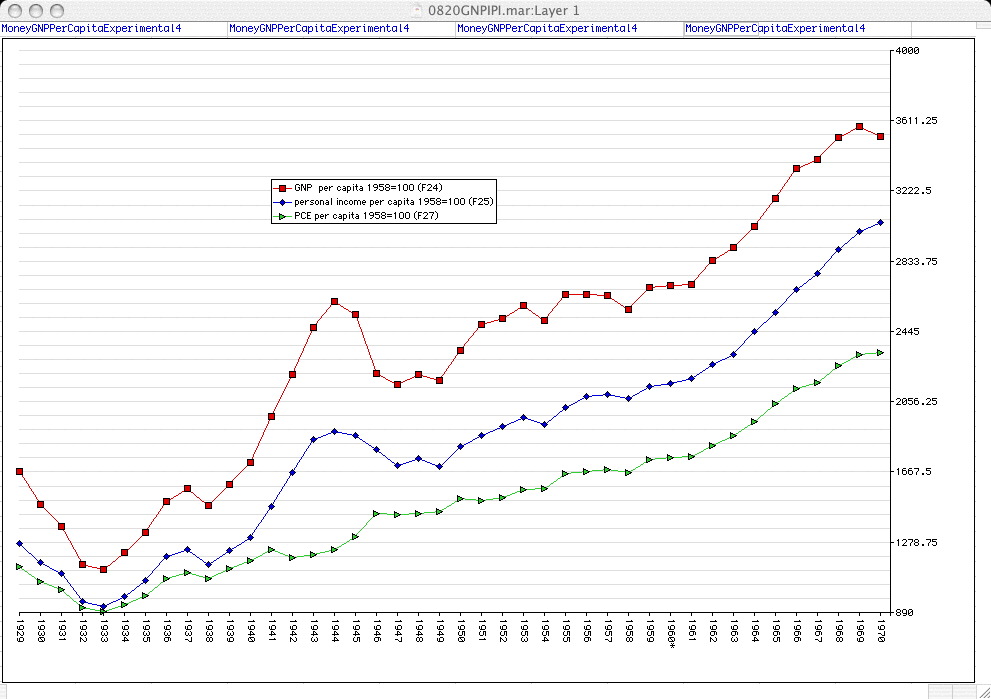
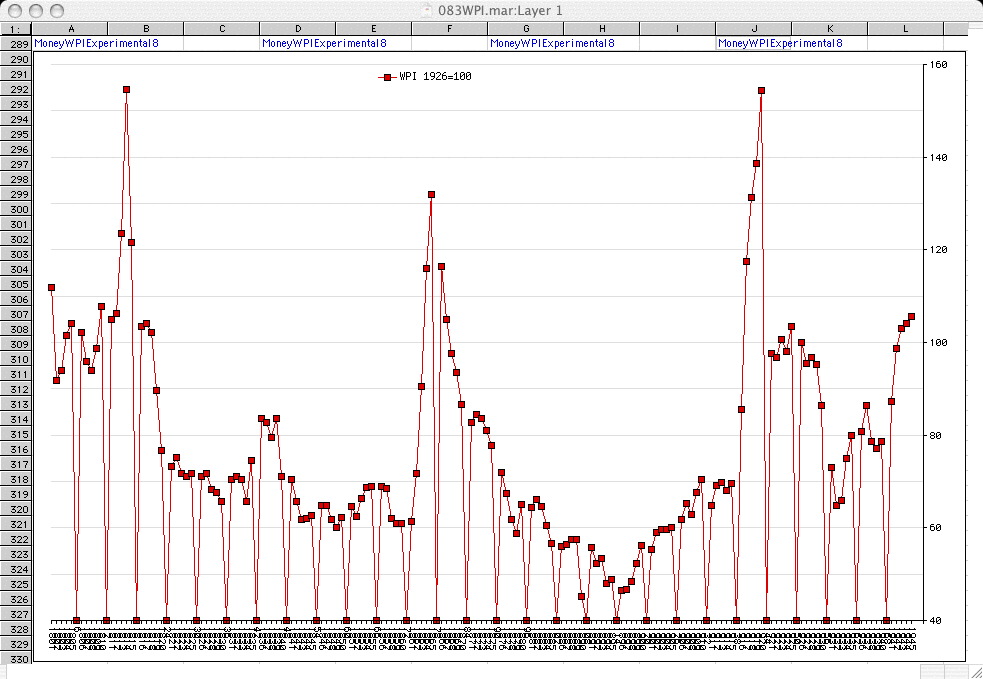
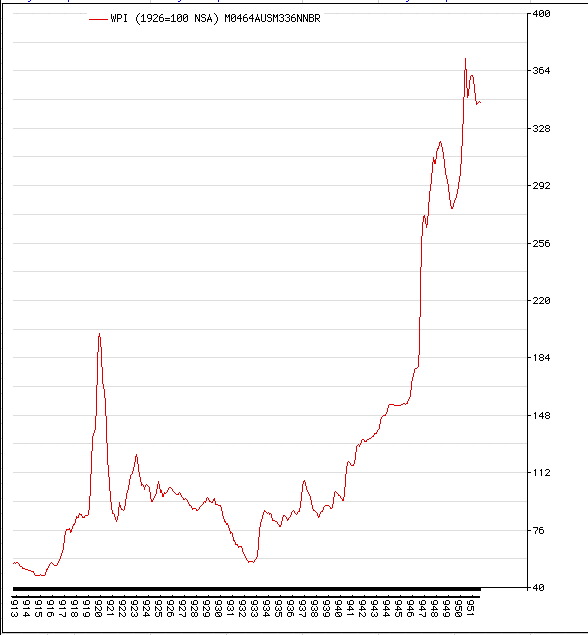
Sometimes I am asked why I graph the deviations between CPI & PPI. When I first started doing economic indicator graphs the data were not available on-line, but I could get into the local "official public federal government document depository" [big signs by the entrance] library and page through the printed (dead-tree) reports. I started graphing CPI & the old WPI (wholesale price index), & GNP implicit price deflators. For some 150 years they tracked each other closely, the curves appearing to be much like 3 vines wrapped around each other.
With the abandonment of GNP for GDP, and WPI for PPI, and then decreased accessibility of the GNP & GDP deflators, things started to get weird. Staples (e.g. salted butter, apples, peanut butter) are disappearing from price indices. And I could no longer get into the so-called public government document depository, because some fruit-cake sheister, most likely an Illiberal Leftist/ Dem/ Red/ Regressive/ Socialist/ Fascist/ Nazi/ Marxist/ Communist/ Maoist/ Collectivist sheister (they are knee-deep in these parts, blocks & blocks of them circling around the state capitol), came in shooting at random & the snow-flakes ❄ cowered & shook in the stair-wells. So, in violation of federal law & the USA constitution, rather than properly train and arm people to discourage such initations of force, they created another attacker-safe-zone to let the next of their cronies wreak more harm. Only groveling, privacy surrendering subjects allowed, not "the public". Who knows what "the public" or the citizenry might conclude if they could get their eyes on federal government documents. They might get ideas about what the Fed & swamp-monsters were up to and maybe try to curb the corruption, unlike the racist, anti-family, anti-fatherhood, anti-USA-constitution, mostly-violent rioting Illiberal Leftist/ Dem/ Red/ Regressive/ Socialist/ Fascist/ Nazi/ Marxist/ Communist/ Maoist/ Collectivist shock-troops of the last few years.
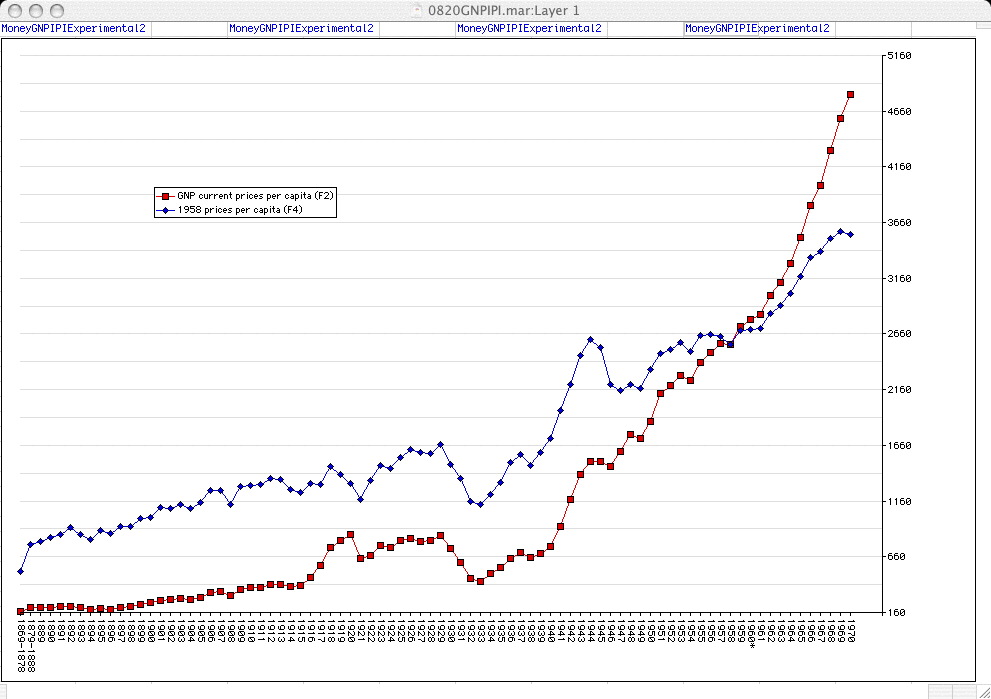
But then I noticed that the current price indices were not twining closely together, but diverging. It's like the election/vote corruption moves over the last few years in PA & MI & other states & cities subjugated by Illiberal Leftists/ Dems/ Reds/ Regressives/ Socialists/ Fascists/ Nazis/ Marxists/ Communists/ Maoists/ Collectivists (which corruptions enable more corruption & fraud). The votes & available price indices are essentially impossible to cross-check, to audit. The chain of responsibility, chain of custody, the connection with reality, the connections with the voters' expressed preferences, observing of the supply & demand & price balancing act, is intentionally destroyed. The transport & transfer of ballots means that ballots seem to be manufactured by political operatives rather than cast by citizens. Results are reported, but they no longer seem to have any certain basis in reality.
We see prices go up, or quality go down (e.g. plastic made to appear to be stronger, more durable metal), or the price for a container stay the same while the quantity in the container (jar, can, box, package) decreases (shrinkflation) irregularly. Instead of base-years or base-months, some indices have base year-spans which cannot be checked against other web-published data.
It is curiouser and curiouser.
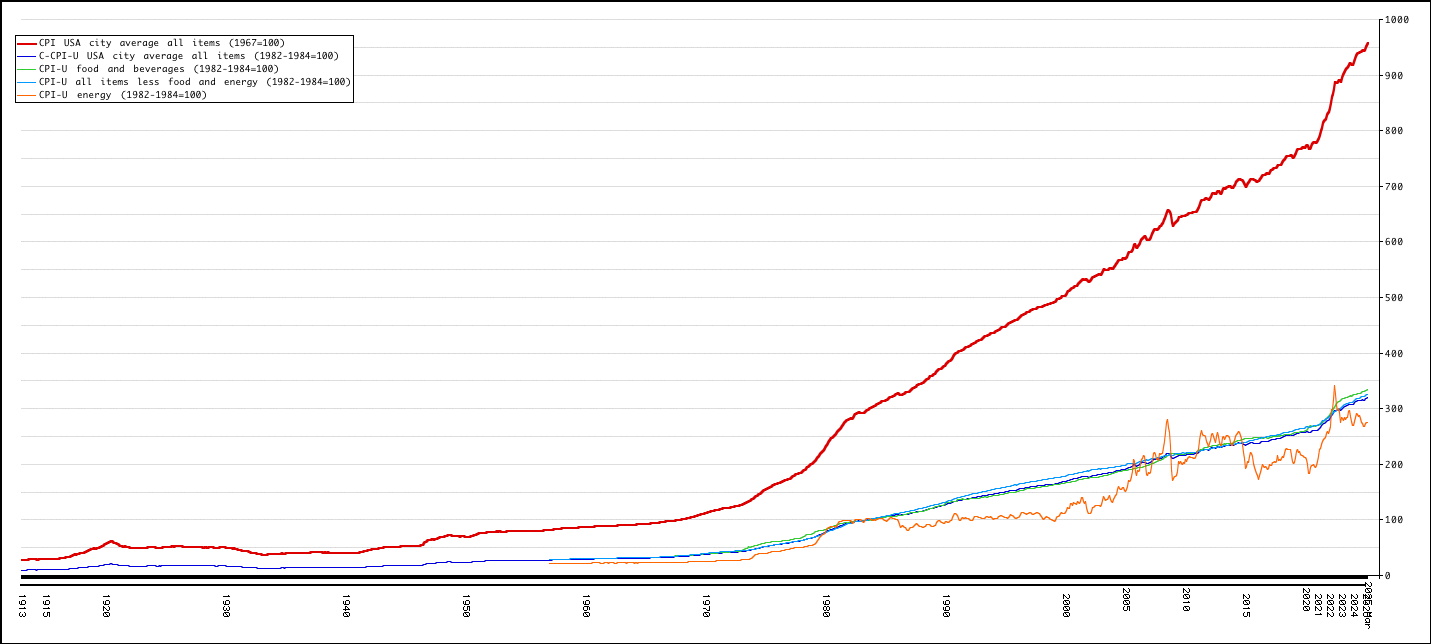
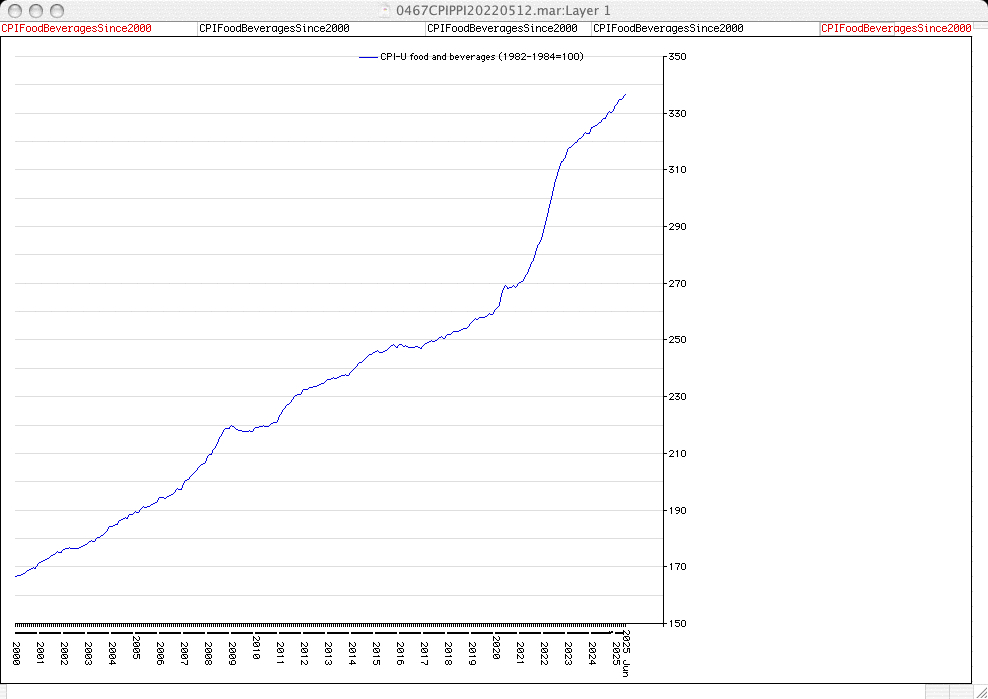
This one is generally junk because base: 1982-1984=100, 1967=100 (Grump grump grump. I wish they'd used a single base-year or base-month, preferably in 1900 or 1913, but they don't have the detailed, consistently-collected data for many of these, though some specific item/specific work/wage price data goes back for 4 centuries or more. As it is, there is a lot of incommensurate jumble.)
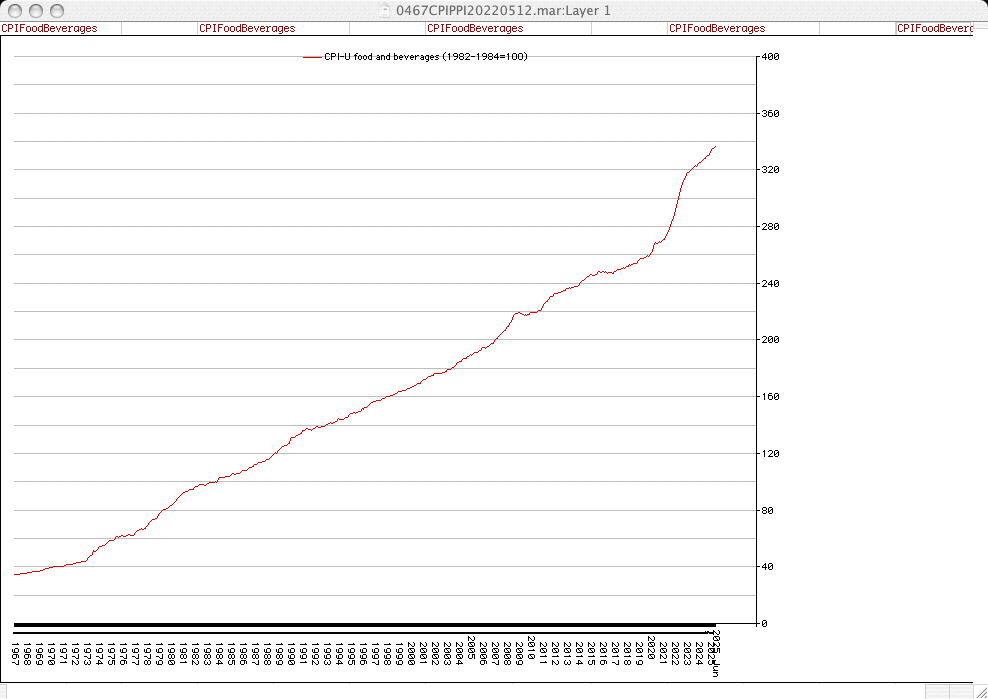
food & beverages
Producer Prices (formerly called Wholesale prices, but slightly re-defined)
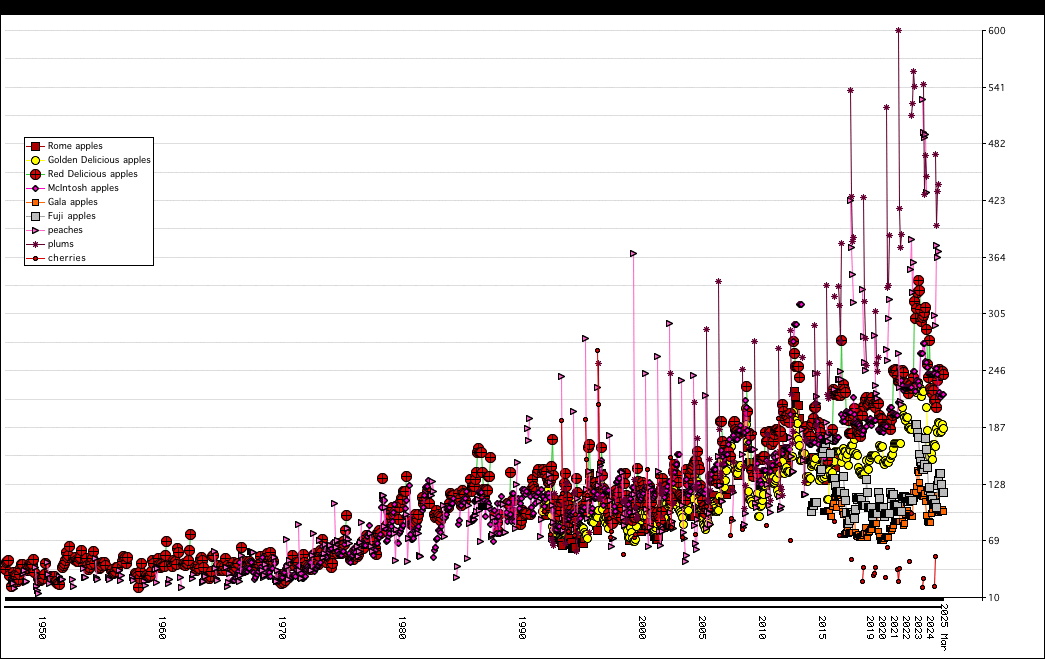
PPI for apples, peaches, plums, & cherries
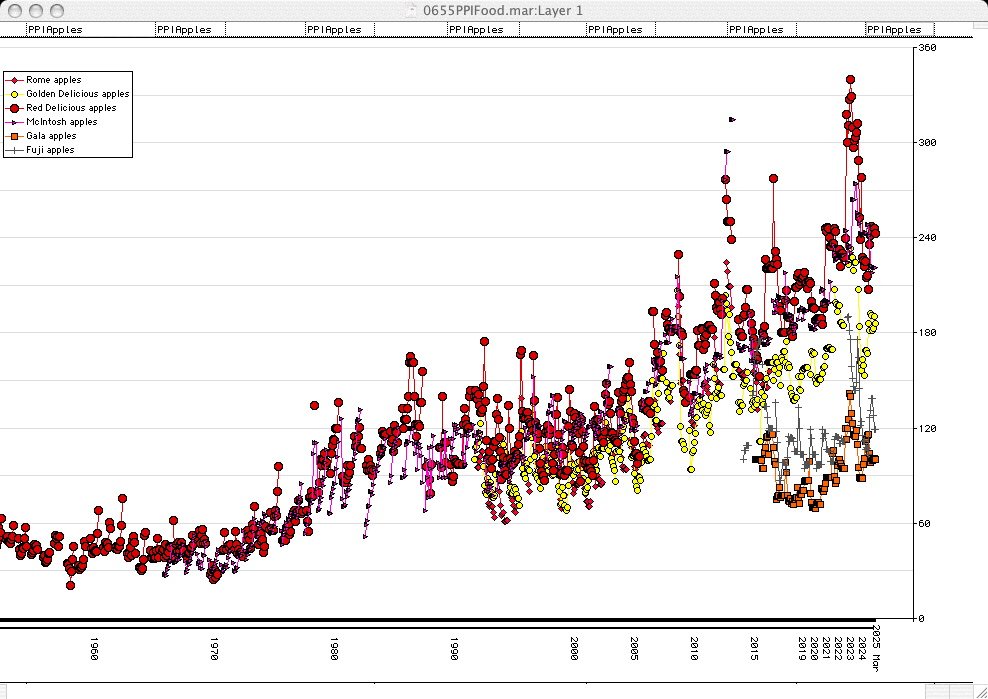
producer prices for apples 🍎 🍏
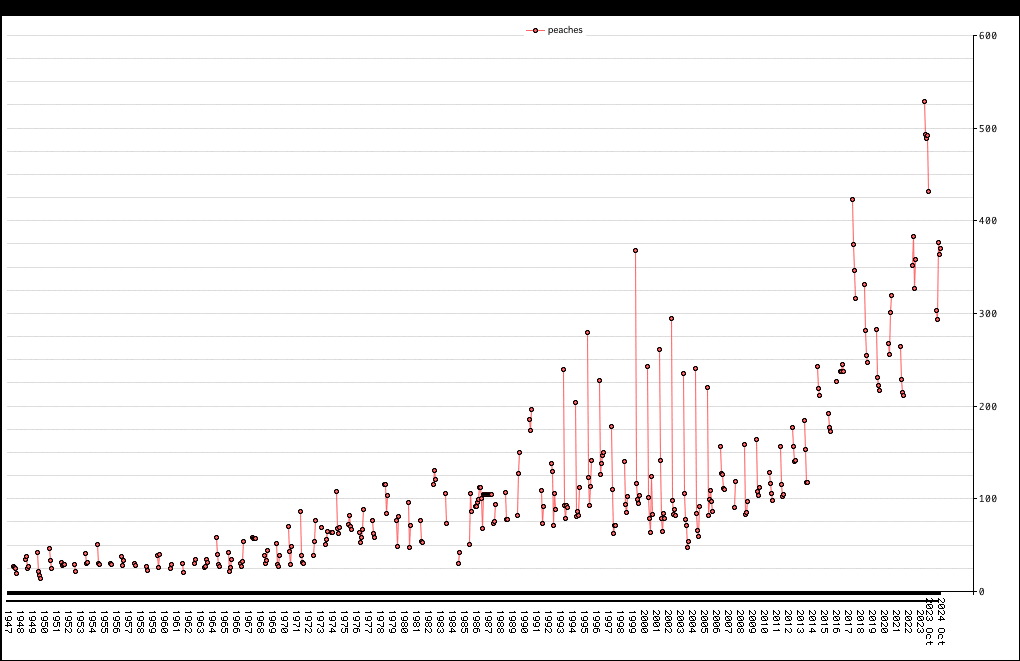
PPI for peaches
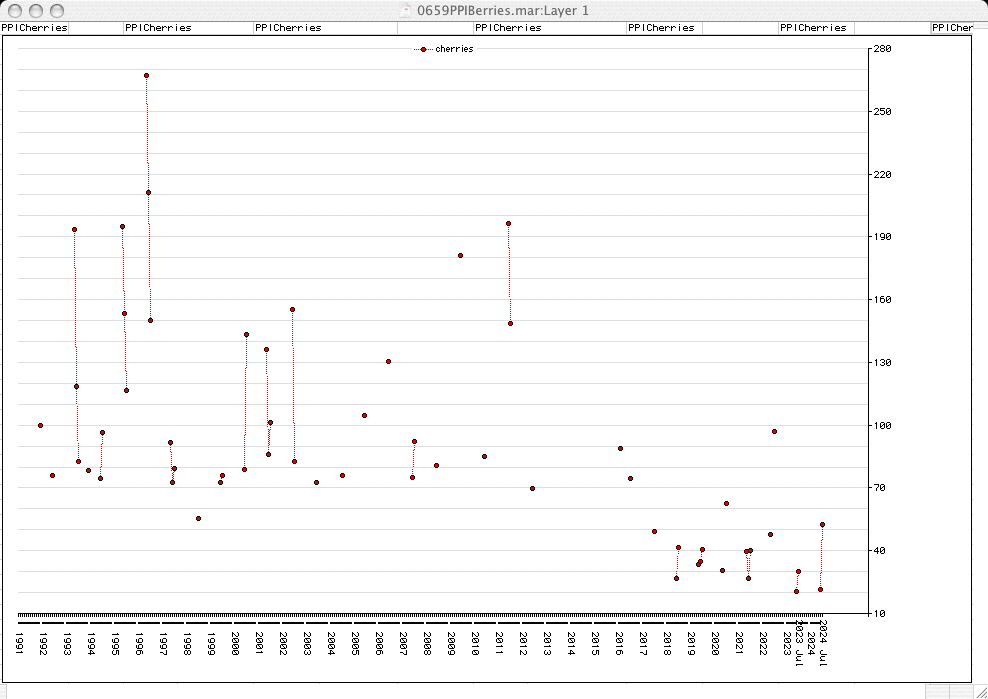
PPI for cherries
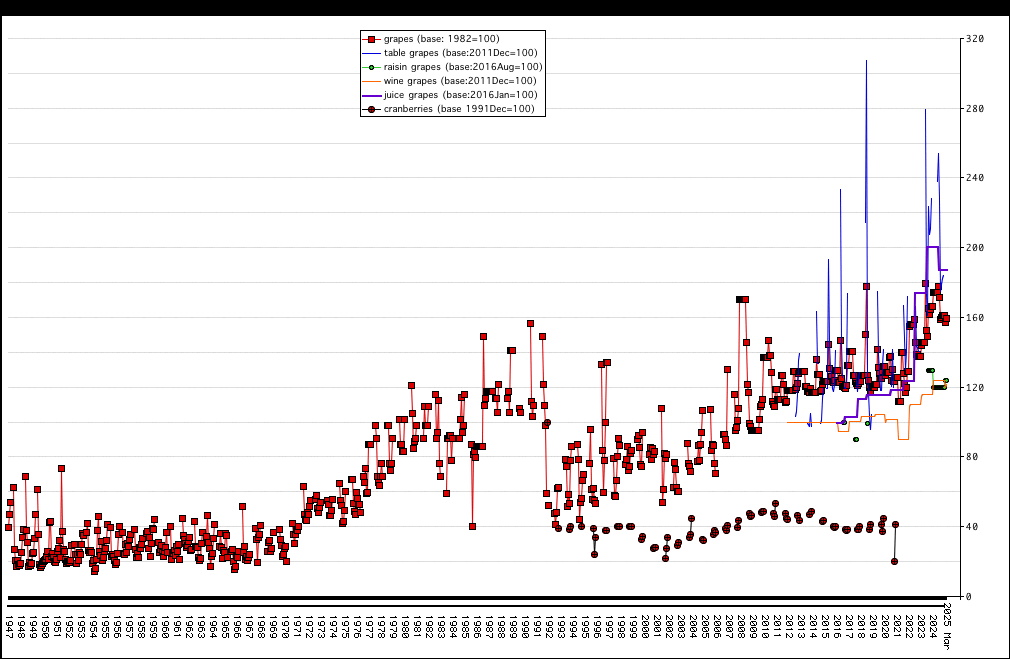
producer price indices for food grapes 🍇... & cranberries
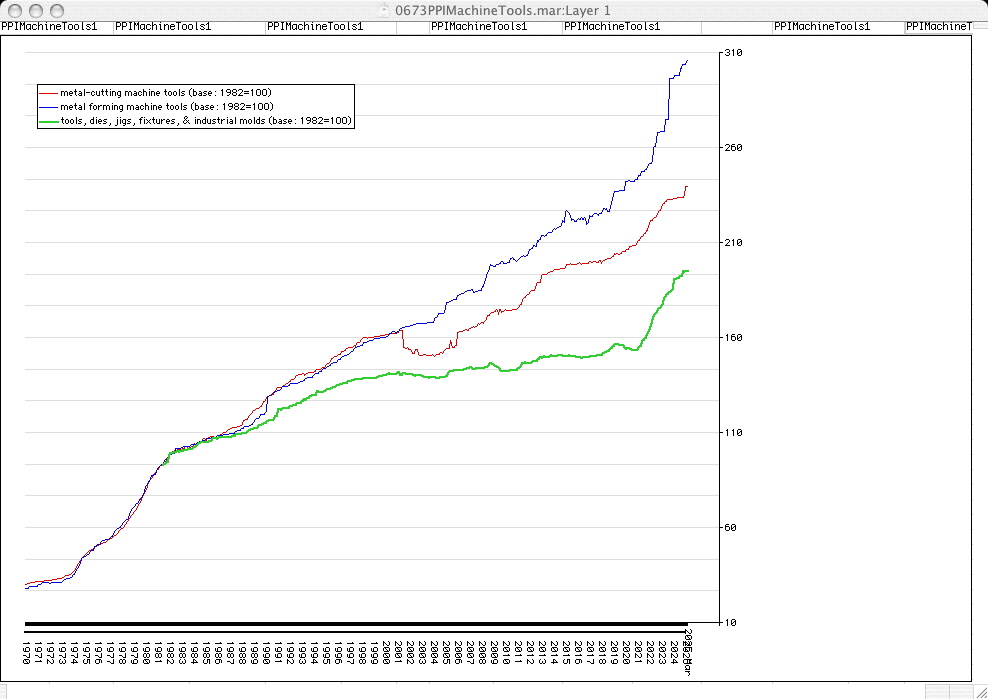
If the curve turns down, that indicates recovery from inflation, i.e. a period of deflation, as the mal-investment is re-absorbed into more genuinely useful/valuable purposes as determined by negotiations between sellers & purchasers. If it is steeper during a stretch of time, then the inflation has accelerated (worsened more rapidly)...jgo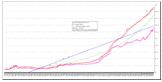
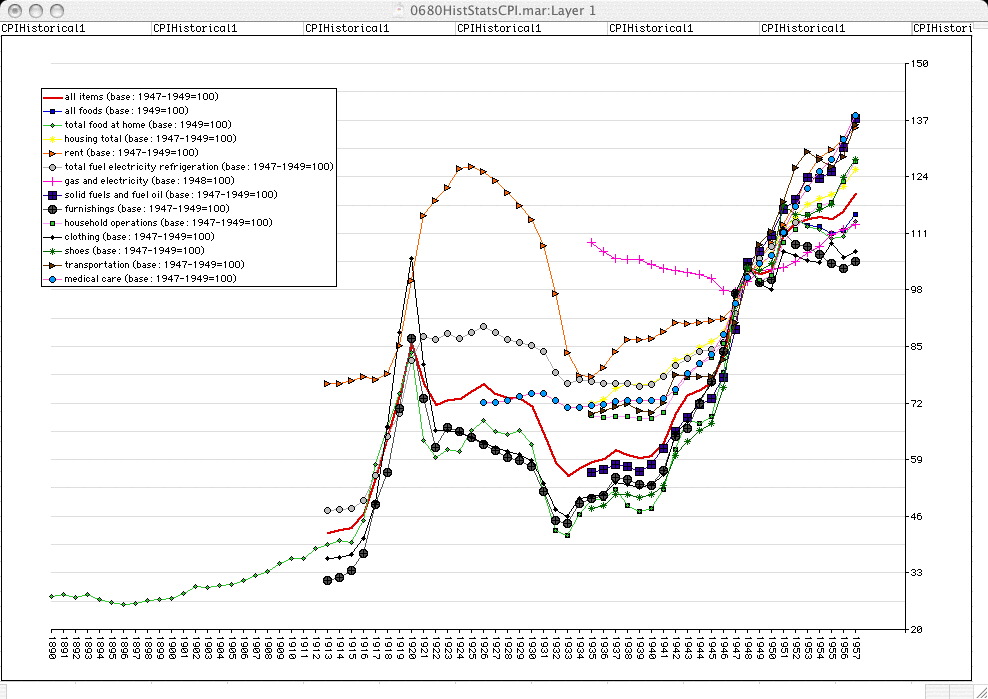
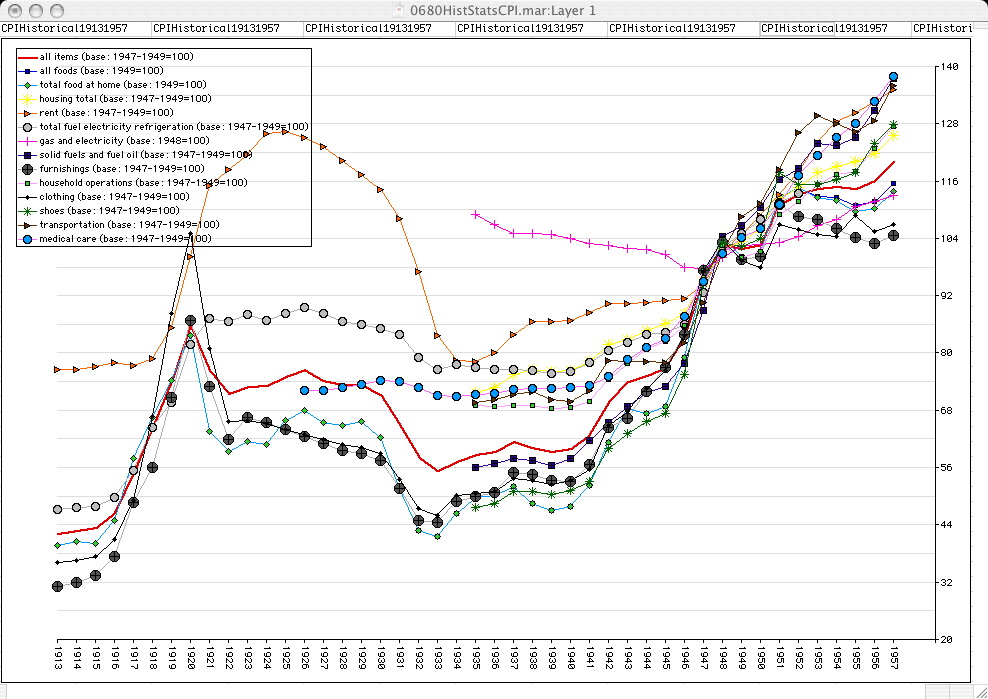
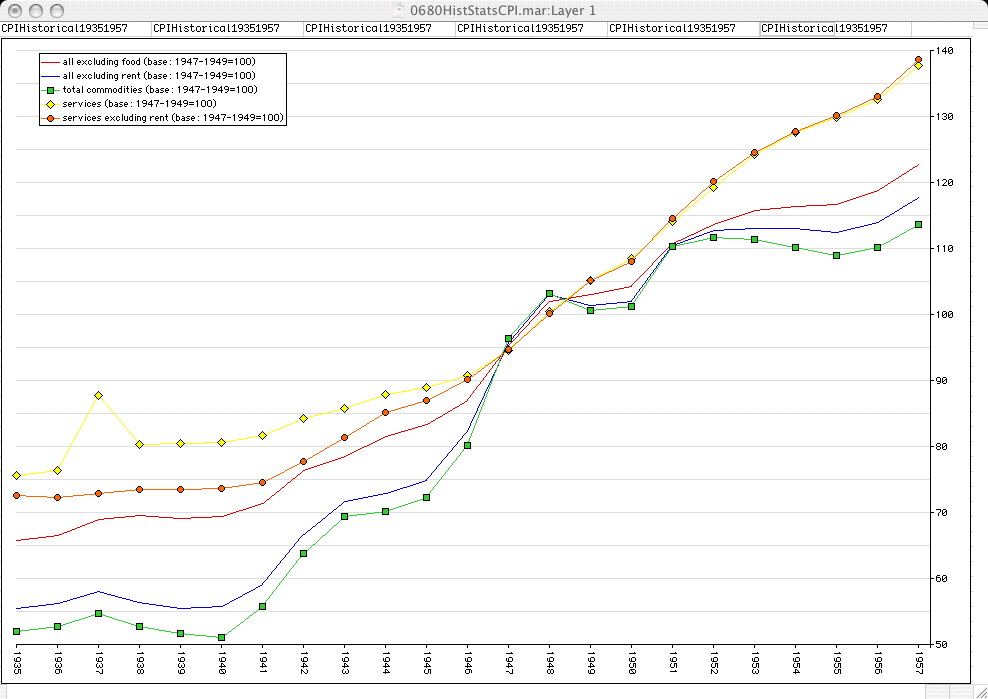
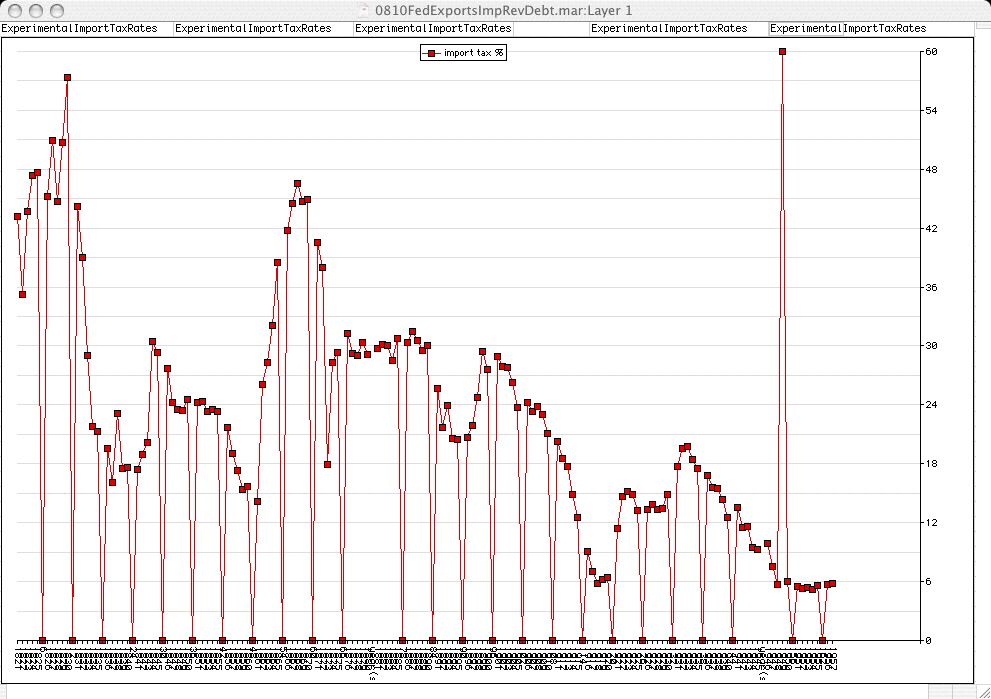
Monthly Consumer Price Index (CPI) & Producer Price Index (PPI) (since 1913)
CPI & PPI (since c. 1950)
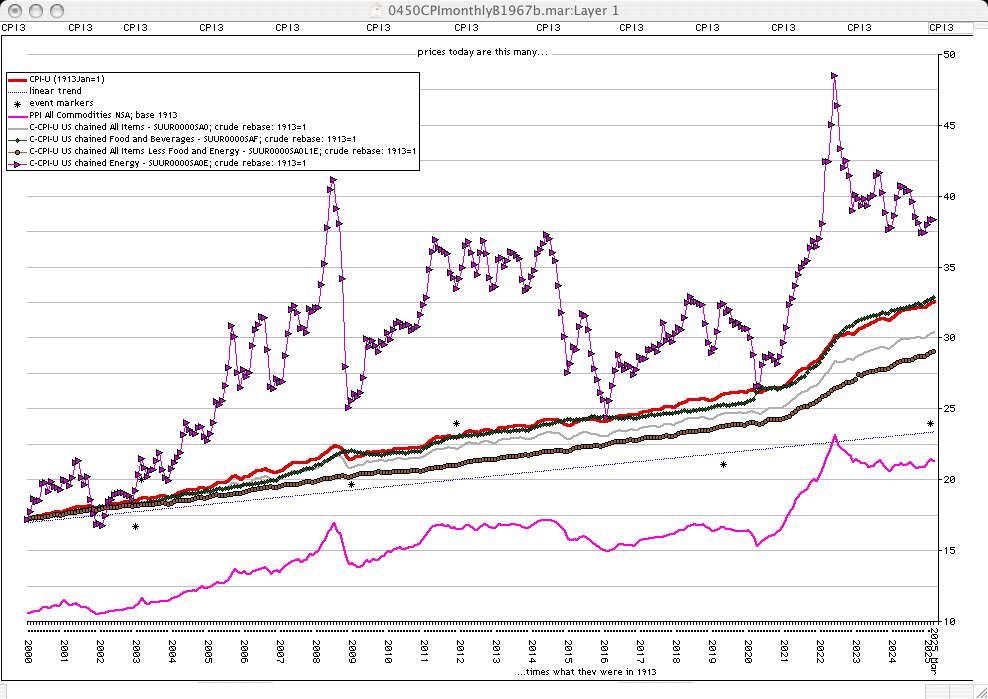
CPI, PPI, chained food & beverages, chained all except food & energy, chained energy (since c.2000)
CPI - PPI divergence (focus on recent years)
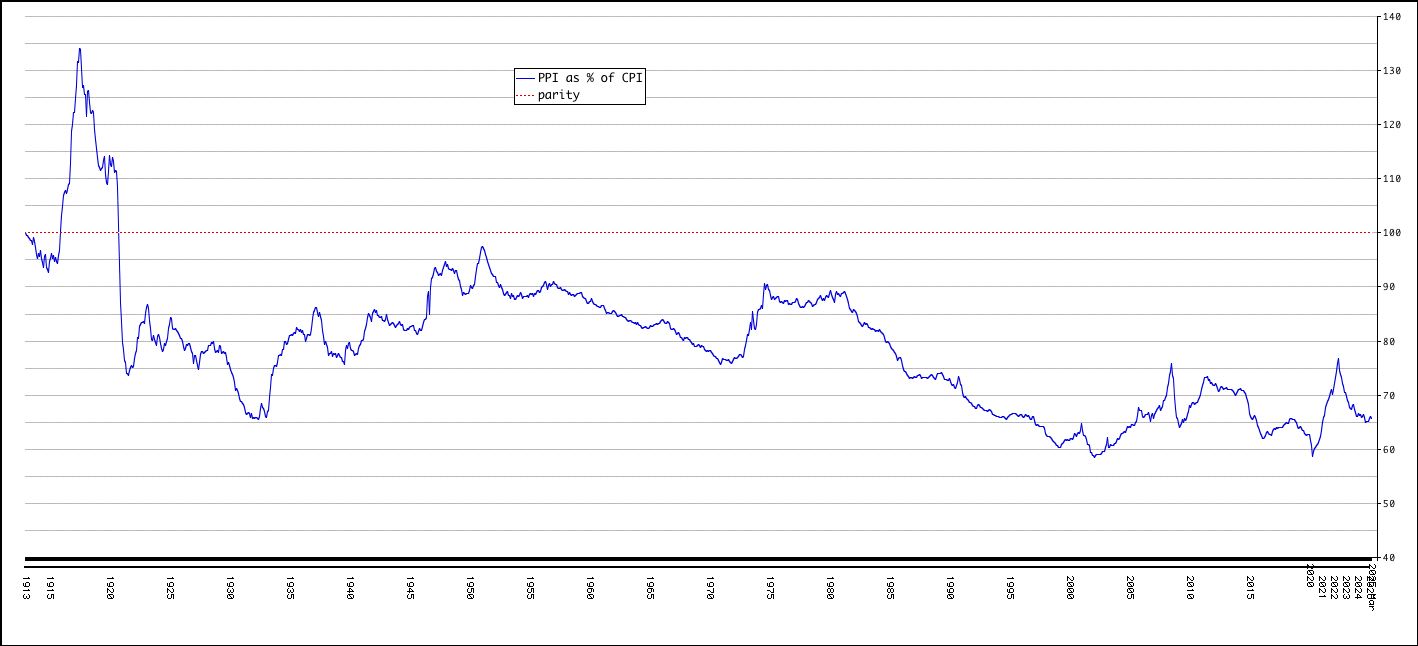
PPI as percentage of CPI, 1913-1992 (after normalization to 1913=1)
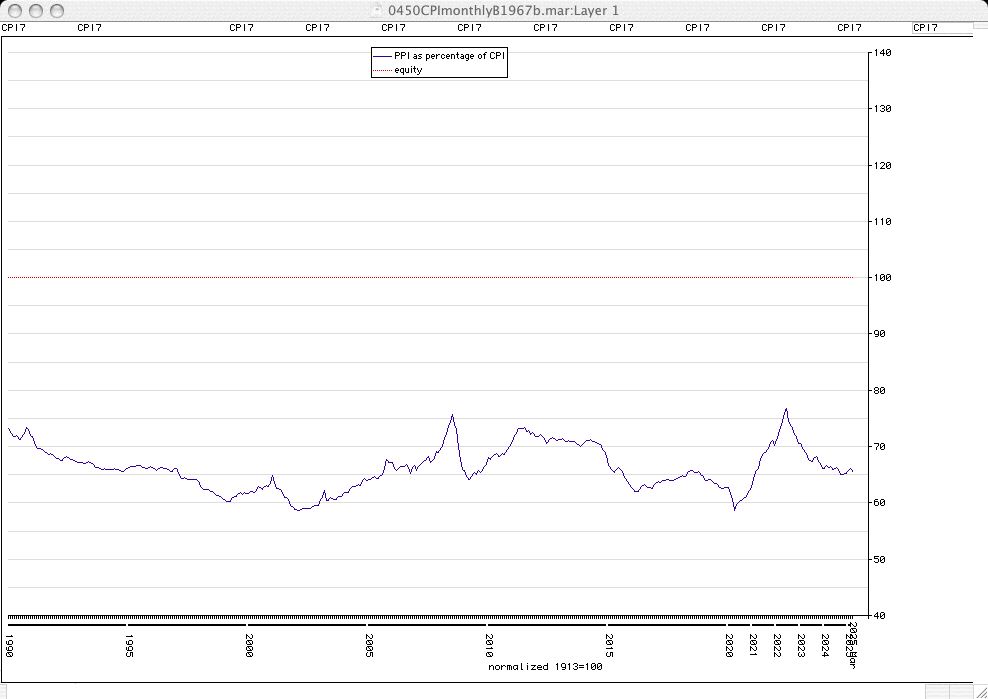
PPI as percentage of CPI, 1990- (after normalization to 1913=1)
CUUR0000AA0
WPU00000000
CUUR0000SA0
CUUR0000SAF
CUUR0000SA0L1E
CUUR0000SA0E
SUUR0000SA0
SUUR0000SAF
SUUR0000SA0L1E
SUUR0000SA0E
retrieved via https://data.bls.gov/series-report BLS data retrieval tool 🧰
APU00007471A
APU000072620
APU000072610
retrieved via https://data.bls.gov/series-report BLS data retrieval tool 🧰
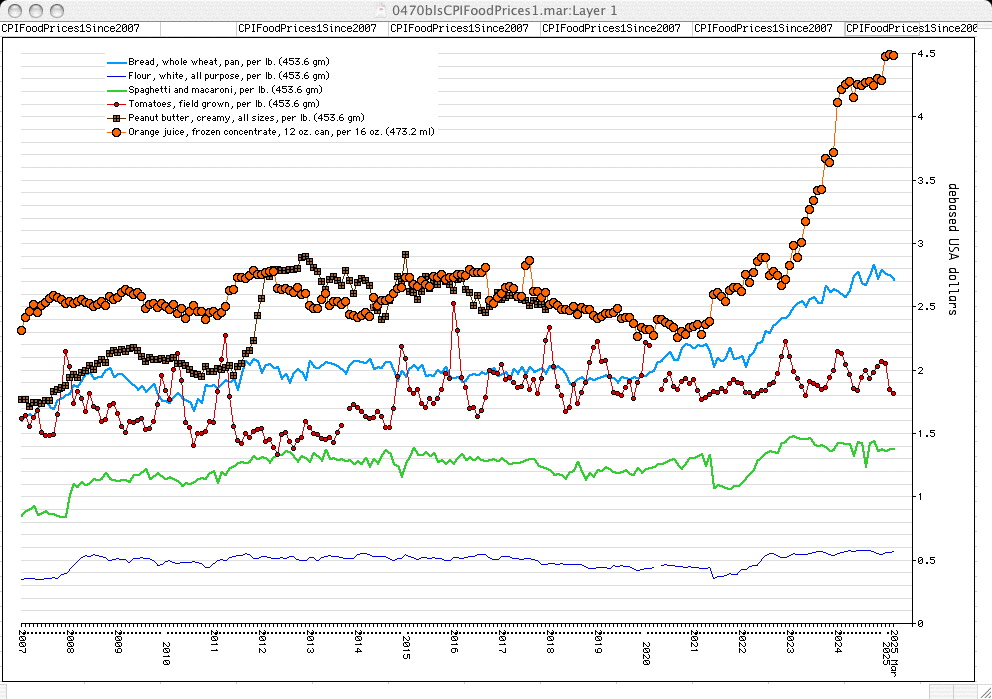
Consumer Food Prices (group 1; since 2007)
APU0000702212 (whole wheat bread 🍞)
APU0000701111 (white wheat flour 🌾)
APU0000701322 (pasta)
APU0000712311 (tomatoes 🍅)
APU0000716141 (creamy peanut butter)
APU0000713111 (frozen orange juice)
(APU0000716141: creamy peanut butter price index apparently discontinued as though it were not still a very important survival food in the age of the Bush-Clinton-Shrub-Obummer/BiteMe-Trump-BiteMe/Harass economic mega-depression), though it is still on the WIC (women, infants, children) list, and some households consume 3-5 pounds per week. Which wunderkind(s) made this decision? And why? The one response I got from any one at BLS was, "No one cares about the price of peanut butter."
"Official" "Data".org
average prices vs. CPI
"Changes in quality can cause increases or decreases in average prices."
APU0000710211 (American processed/emulsified cheese)
APU0000710212 (cheddar cheese 🧀)
APU0000709112 (fresh whole fortified milk 🥛)
APU0000710111 (grade AA salted butter 🧈)
APU0000708111 (grade A large eggs 🥚)
APU0000712112 (white potatoes 🥔)
APU0000711311 (navel oranges 🍊)
APU0000711211 (bananas 🍌)
APU0000711111 (red delicious apples 🍎)
APU0000702421 (chocolate chip cookies 🍪)
(APU0000710111: grade AA salted butter price index discontinued as though it were not a staple in the age of the Bush-Clinton-Shrub-Obummer/BiteMe-Trump-BiteMe/Harass economic mega-depression)
(APU0000711111: red delicious apples price index discontinued as though it were not a staple in the age of the Bush-Clinton-Shrub-Obummer/BiteMe-Trump-BiteMe/Harass economic mega-depression). Wunderkind(s)!
APU0000717311
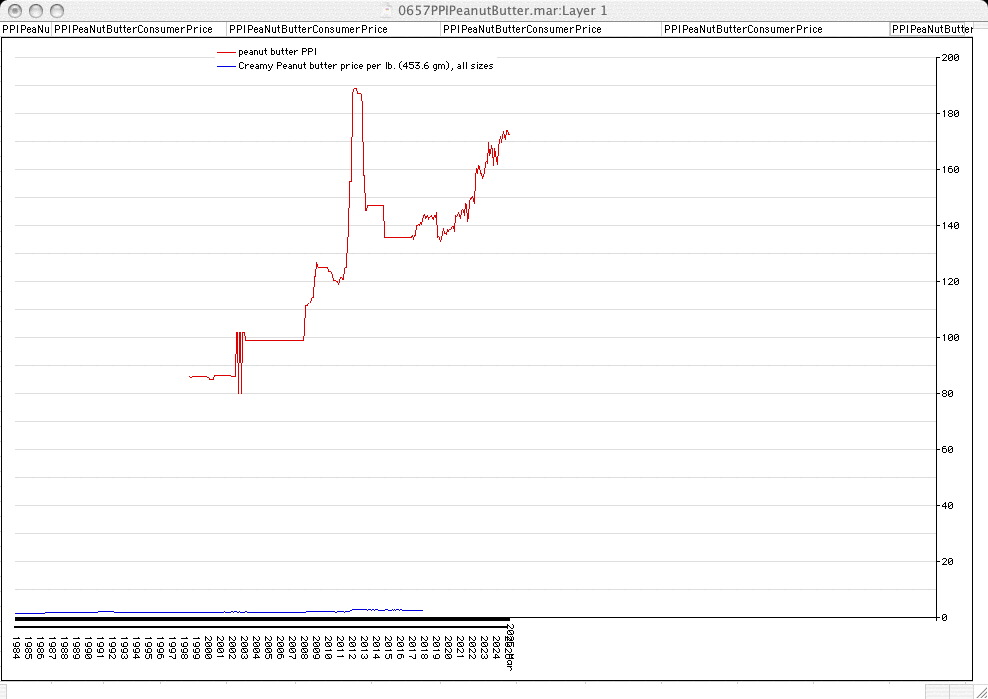
WPU02890158 (producer price index for peanut butter 🥜)
APU0000716141 (consumer price for creamy peanut butter 🥜)
Producer Price Index (PPI) peanut butter (Apparently, the makers of peanut-butter flavored cookies, crackers, etc. care.)
PPI peanut butter & consumer price peanut butter
ratio of peanut butter producer price index ÷ corresponding consumer price (for months when both were reported)
CPI Butter 1971-2002 🧈
CPI Butter since 2000 🧈
CUUR0000SS10011 (not seasonally adjusted=NSA)
CUSR0000SS10011 (seasonally adjusted; gap/missing 1987-1998)
CUUR0000SAF112
Consumer prices Ground Chuck, Beef, Lean, Beef Roasts Price since 2000
APU0000703111
APU0000703112
APU0000703113
APU0000FC2101
Consumer prices (poultry) whole chicken, turkey price per pound since 2000
APU0000706111
APU0000706311
WPU01110303 (watermelon 🍉)
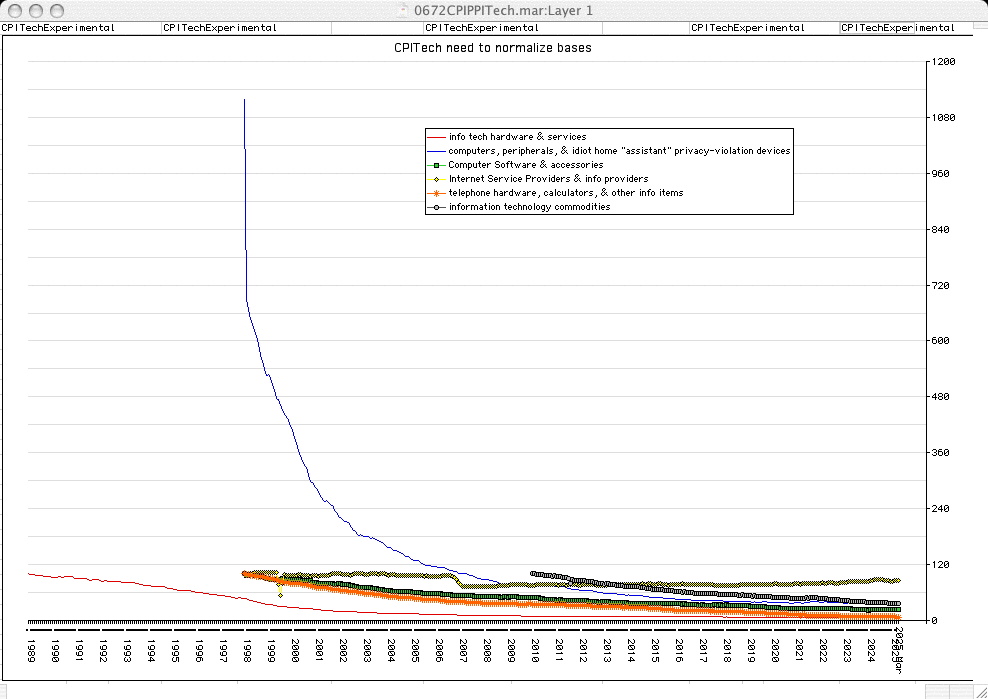
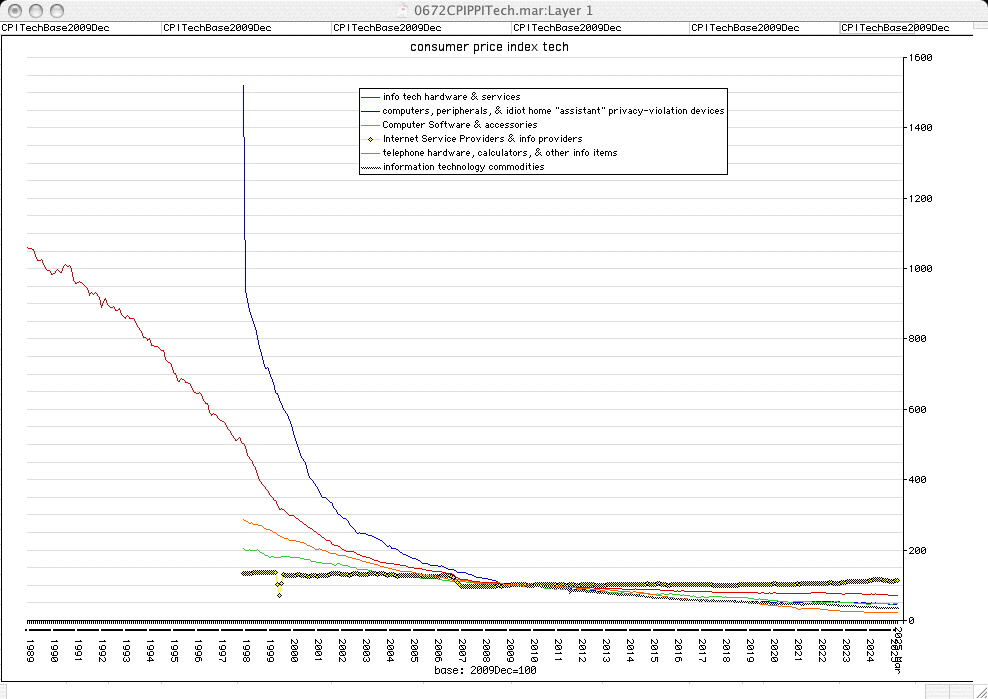
general experimental
CUUR0000SA0 (all)
CUUR0000SAF (food & beverages)
CUUR0000SA0L1E (all - (food & beverages & energy))
CUUR0000SA0E (energy)
general experimental
general experimental
producer prices for apples 🍎 🍏
WPU01110209 (Rome apples)
WPU01110211 (Golden Delicious apples)
WPU01110215 (Red Delicious apples)
WPU01110216 (McIntosh apples)
WPU01110220 (Gala apples)
WPU01110229 (Fuji apples)
WPU01110219 (peaches 🍑)
WPU01110201 (plums)
WPU01110203 (cherries 🍒)
WPU01110228 (grapes)
WPU011102281 (table grapes)
WPU011102282 (raisin grapes)
WPU011102283 (wine grapes)
WPU011102284 (juice grapes)
WPU01110226 (cranberries)
BLS producer price index (PPI) series IDs
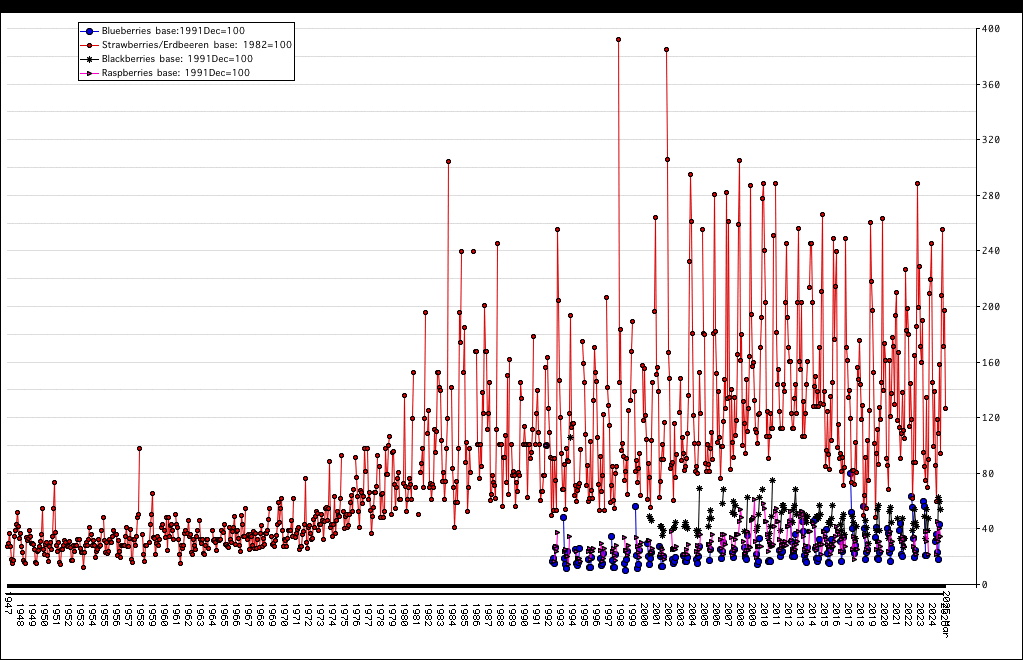
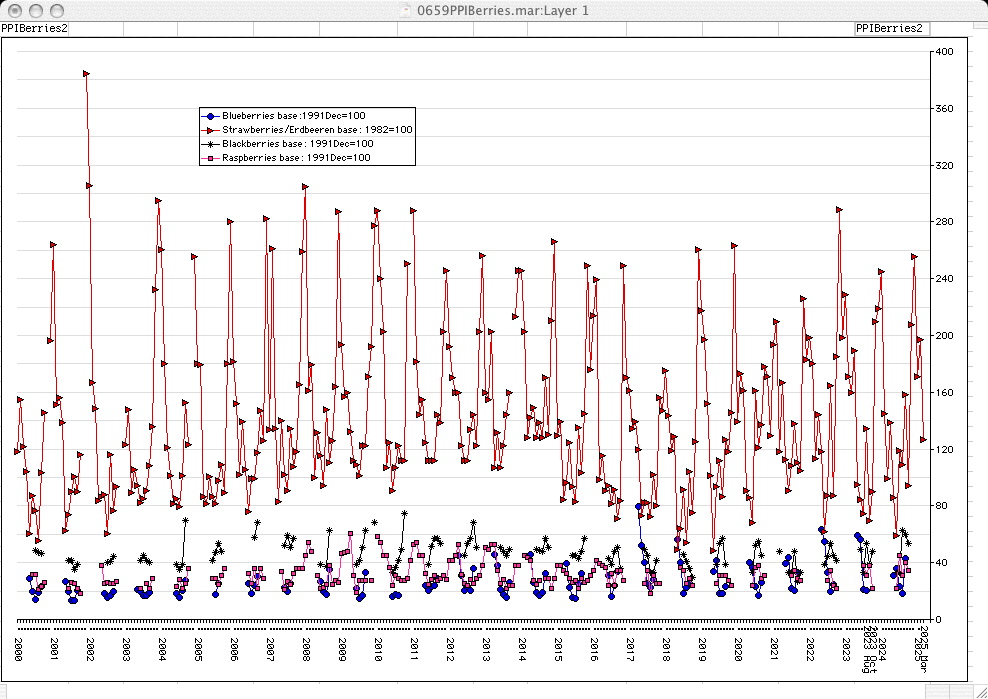
PPI for berries since 2000
WPU01110227 (Blueberries 🫐)
WPU01110222 (Strawberries/Erdbeeren 🍓)
WPU01110225 (Blackberries)
WPU01110224 (Raspberries)
producer price indices for food 🍊 🍋
producer price indices for food 🍅
producer price indices for food 🥔
BLS producer price index (PPI) series IDs
base=1999=100 consumer prices chained ⛓ (as the ancients [Don Covay & Aretha Franklin♩] warned us: ⛓ "chain chain chain, chain of fools" 🤡)
SUUR0000SA0 (all)
SUUR0000SAF (food & beverages)
SUUR0000SA0L1E (all - (food & beverages & energy))
SUUR0000SA0E (energy 🌥 ⚡🌩 ⚛🌞 🧊 🧣🧤 🛢⛽ 💡 🌬🌊 🔋🔌)
retrieved via https://data.bls.gov/series-report BLS data retrieval tool 🧰
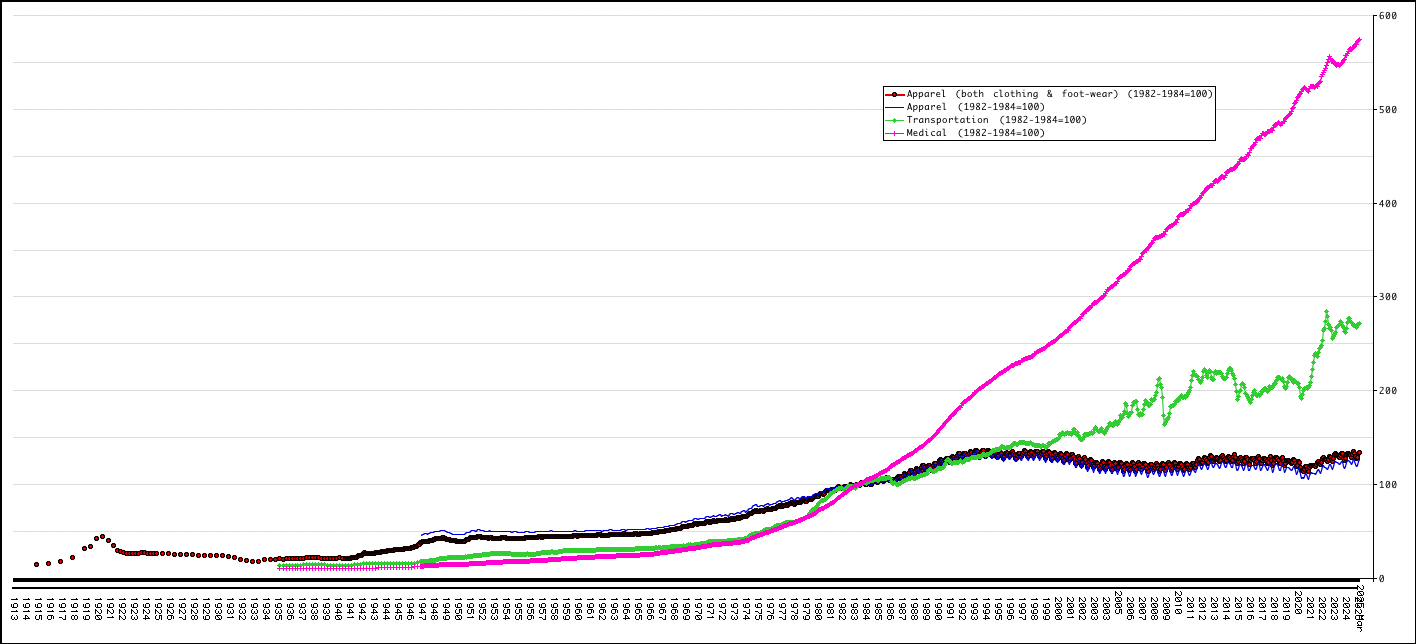
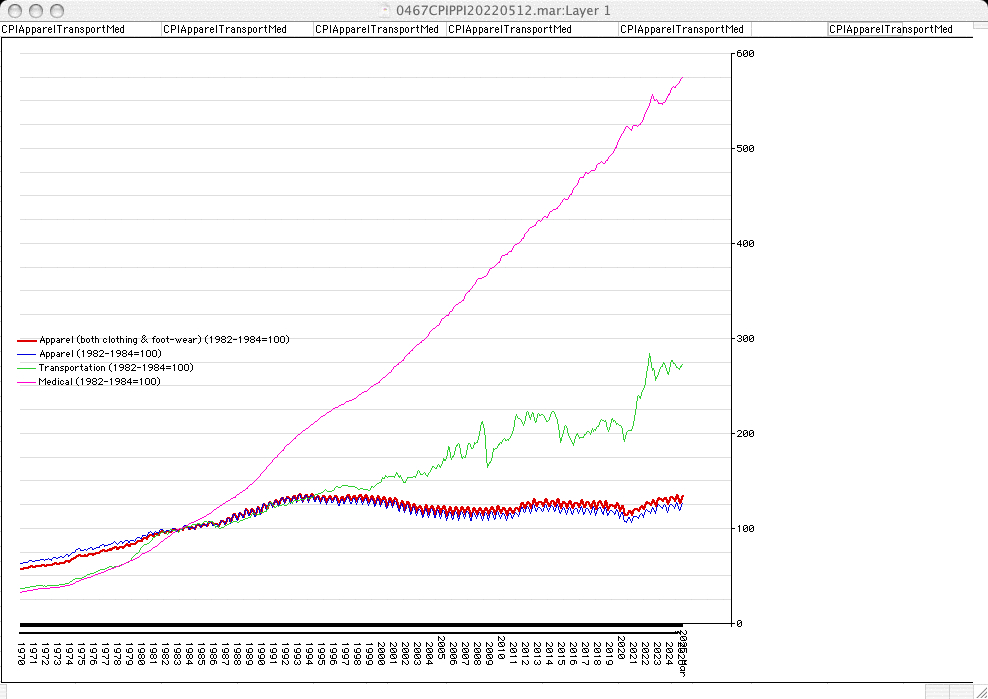
consumer price index general experimental 2
consumer price index since 1970
base: average(1982-1984)=100
CUUR0000SAA (Apparel (both clothing & foot-wear))
CUUR0000SA311 (Apparel)
CUUR0000SAT (Transportation)
CUUR0000SAM (Medical base: )
retrieved via https://data.bls.gov/series-report BLS data retrieval tool 🧰
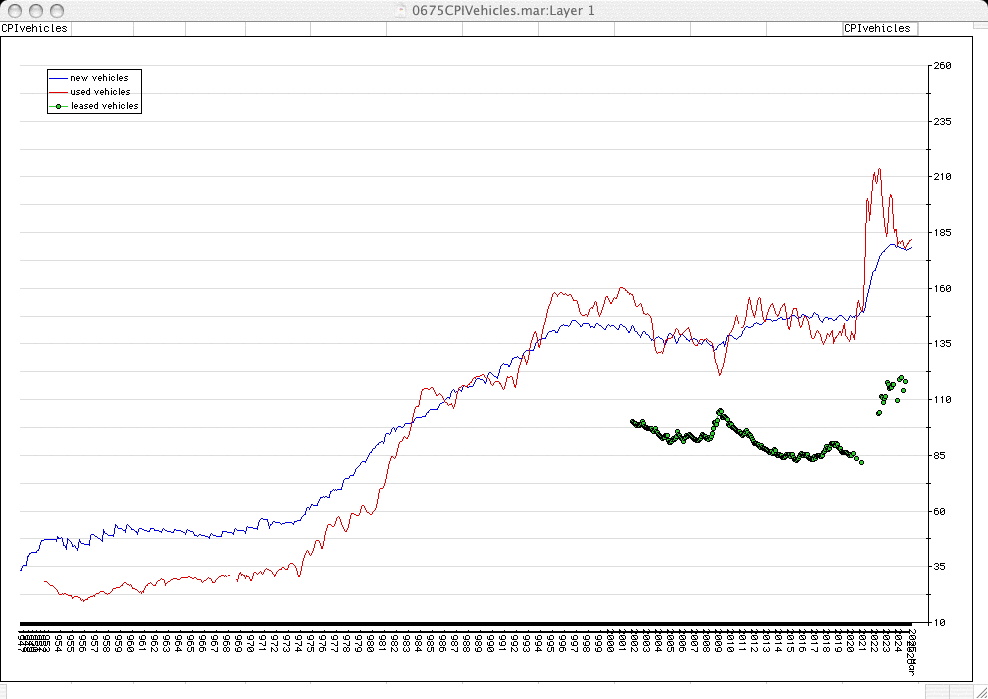
consumer price index vehicles
CUUR0000SETA01 (new base:1982-84=100)
CUUR0000SETA02 (used base:1982-84=100)
CUUR0000SETA03 (leased base:2001 Dec)
retrieved via https://data.bls.gov/series-report BLS data retrieval tool 🧰
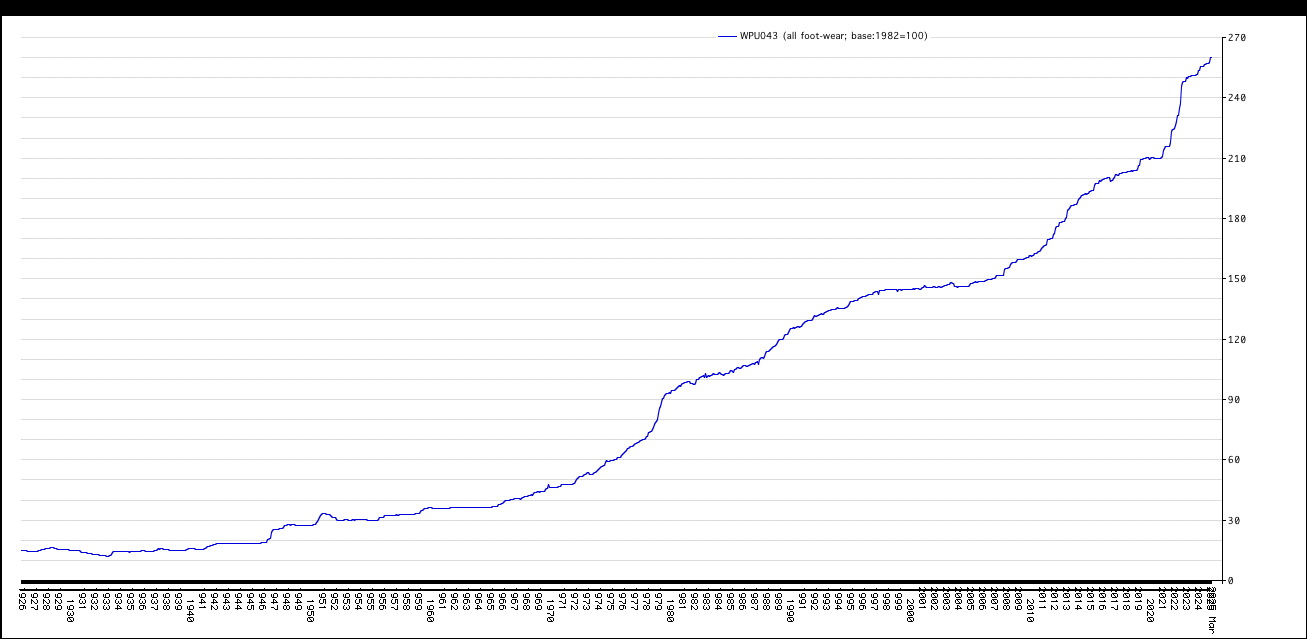
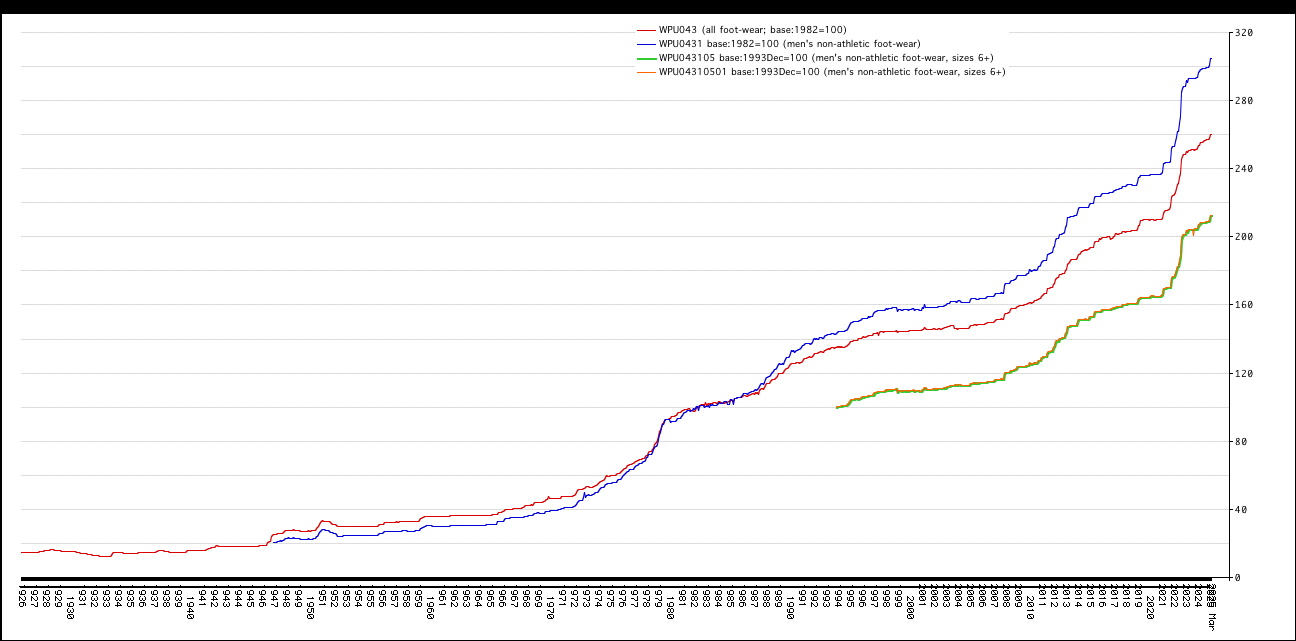
producer price indices for apparel & foot-wear/shoes/boots/slippers; general since 1946 🥾 🥾 👞 👟 👡 👢 🥿 🎿 🩰
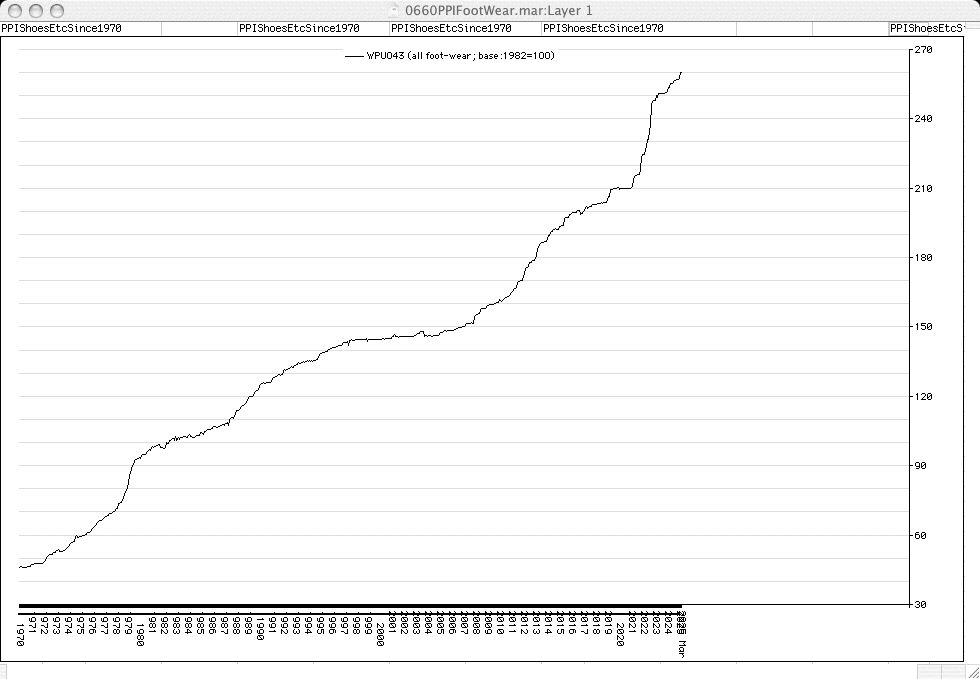
producer price indices for foot-wear/shoes/boots/slippers since 1970.
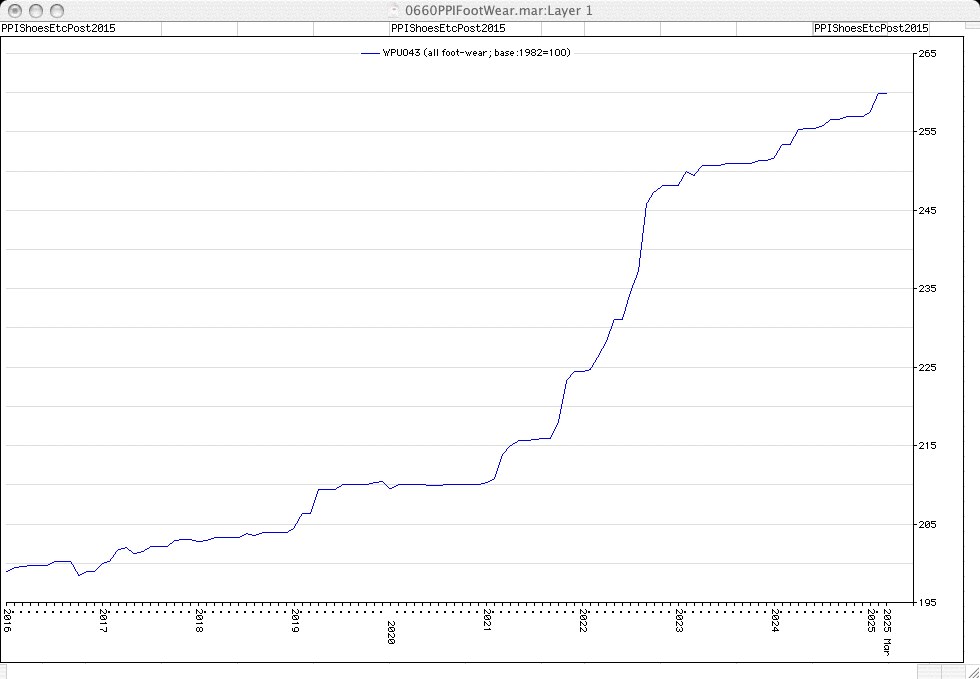
producer price indices for foot-wear/shoes/boots/slippers post 2015.
WPU043 (foot-wear/shoes/boots/slippers)
WPU0431 (men's non-athletic foot-wear)
WPU043105 (men's non-athletic foot-wear, sizes 6+)
WPU04310501 (men's non-athletic foot-wear, sizes 6+)
WPU0432 (women's non-athletic foot-wear)
WPU043105 (women's non-athletic foot-wear, sizes 4+)
WPU04310501 (women's non-athletic foot-wear, sizes 4+)
WPU0439 (other foot-wear, including slippers)
WPU043901 (other foot-wear, excluding rubber & plastic soled foot-wear)
WPU04390104 (other foot-wear, excluding rubber & plastic soled foot-wear)
1st 6 categories since 2000
BLS producer price index (PPI) series IDs
Real Estate, Homes, Land
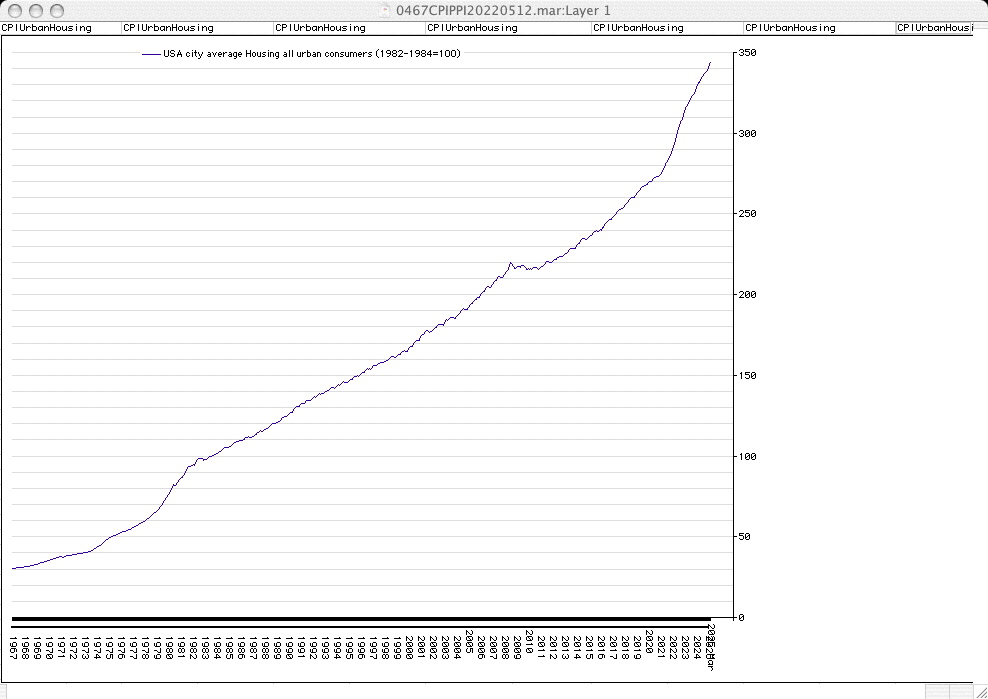
urban housing consumer price index
base:1982-1984=100
CUUR0000SAH (Housing 🏡 🏘 🛖 🏢🏢🏢🏢)
retrieved via https://data.bls.gov/series-report BLS data retrieval tool 🧰
Federal Reserve Economic Data: FRED: new privately-owned housing units, construction started
Federal Reserve Economic Data: FRED: new privately-owned housing units completed
Federal Reserve Economic Data: FRED: housing: median sales price of houses sold
Federal Reserve Economic Data: FRED: housing: median sales price of existing houses
Federal Reserve Economic Data: FRED: housing: average sales price of houses sold
Federal Reserve Economic Data: FRED: house price index USA
Federal Reserve Economic Data: FRED: house price index Ohio
Federal Reserve Economic Data: FRED: number of new single-family houses sold USA
Federal Reserve Economic Data: FRED: housing: median square feet
Federal Reserve Economic Data: FRED: housing: median days on market
Federal Reserve Economic Data: FRED: retail sales of furniture & furnishings
2023-05-31 (5783 Sivan 11)
Allaire Conte _Orchard_
house price to income ratio
2023-04-11: USA Facts: home prices have been rising faster than incomes since 2010 (county by county infographic)
2000 Q4: Shelly Dreiman: Federal Housing Finance Administration: price to income ratio & housing bubbles
2023-01-26: Michelle Delgado: Real Estate "Witch": USA house prices are rising exponentially faster than incomes (prices 218% of what they were in 1965; incomes 115% of what they were in 1965
Census bureau: median housing prices table (1940-2000)
Census bureau: median housing prices table (1940-2000)
Census bureau: median housing prices table adjusted for inflation to 2000 dollars (1940-2000)
retrieved via https://data.bls.gov/series-report BLS data retrieval tool 🧰
Land
