Civilian, Non-Institutionalized Population 16 years & Older, & Ratios
plug: graphs prepared using Mariner Calc, Grab, & Preview
updated: 2026-01-18
| |
"Res ipsa loquitur."
(The facts speak for themselves.)
| |
Ratios of Employed to Civilian, Non-Institutionalized Population 16+ Years Old
(Emp/Pop = {number employed} ÷ {civilian, non-institutionalized population 16 years old & older},
a.k.a. work rate, a.k.a. civilian employment rate, etc.)
(None of these examines or acknowledges the numbers of people in the existing talent pool, and thus shed no light on talent glut, surplus, talent being wasted; nor shortage; nor how vigorously work is being sought, nor how vigorously employees are being sought, nor the ratio of effort used to exclude employment seekers to the effort used to seek employees, nor effort & resource invested to train new-hires or retained employees... All of that is totally ignored, hidden, buried, encrypted. That information might be embarrassing when compared with the lobbying stories, fables, tall tales, narratives, the compensation to productivity ratios, executive compensation to production employee compensation ratios, productivity of founders/inventors vs. the worst/least-productive marginal employee...)

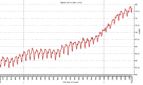
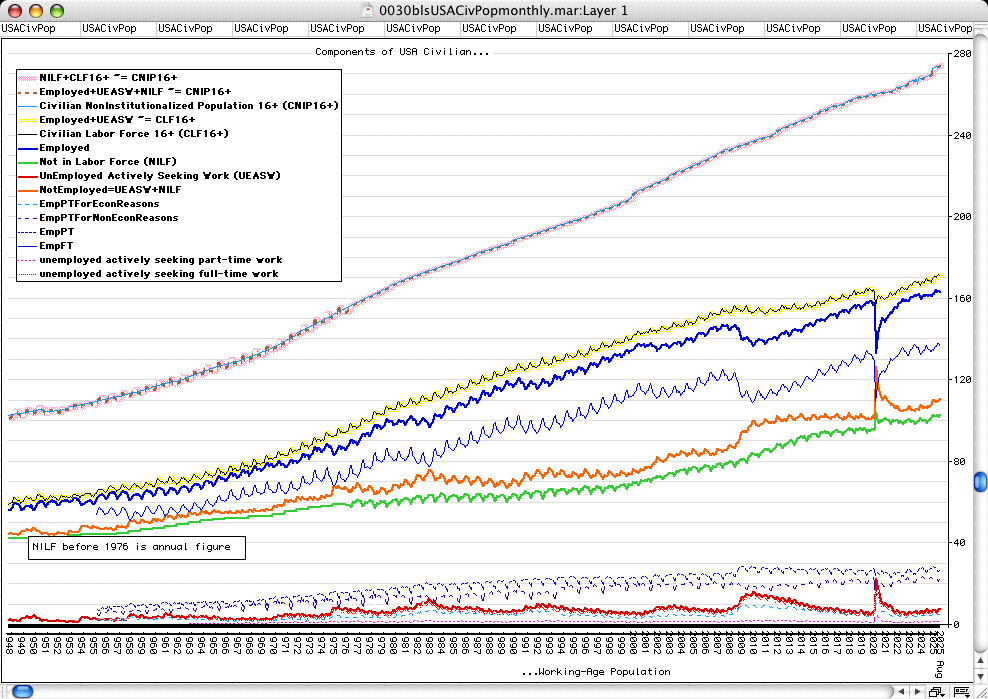
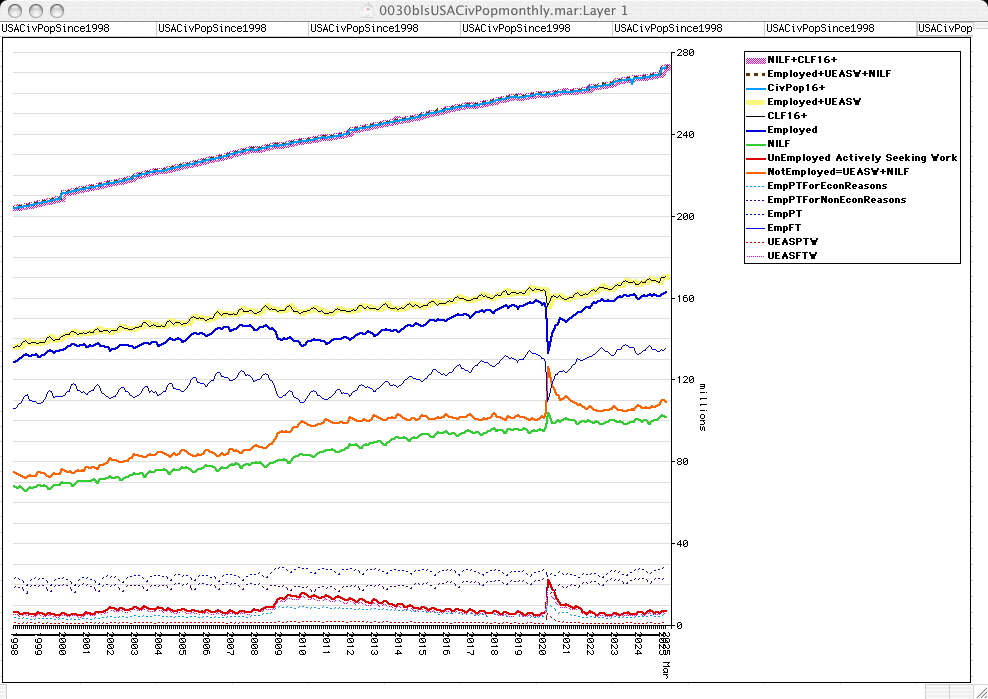
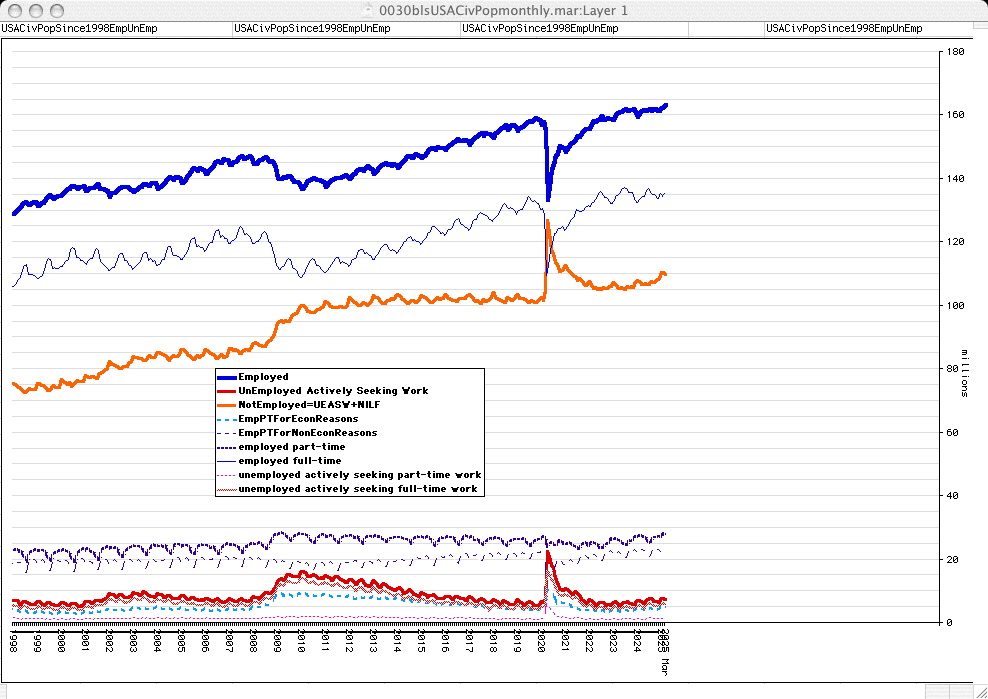
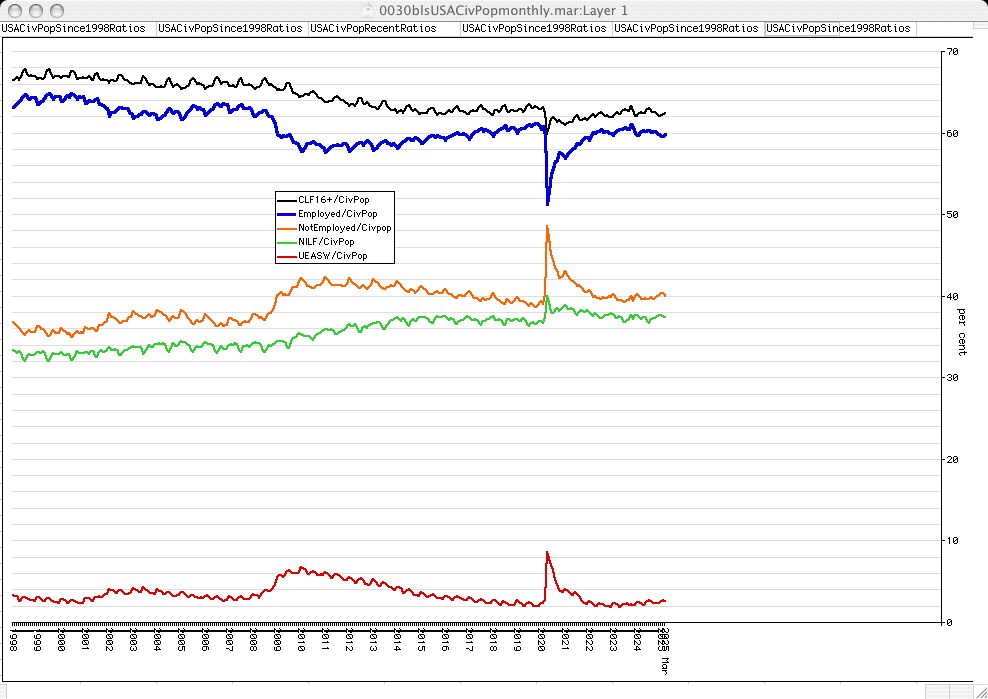
Components of USA Civilian Non-Institutionalized Working-Age Population, 16 years & older (CNIP16+ or simply CivPop)
USA Civ Pop components (since 1998)
LNU00000000 (aggregate Civilian, NON-Institutionalized Population, 16 years and older [CNIP16+])
LNU01000000 (CLF16+ civilian "labor force")
LNU02000000 (Employed)
LNU05000000 (NILF not in "labor force")
LNU03000000 (UEASW UnEmployed actively seeking work)
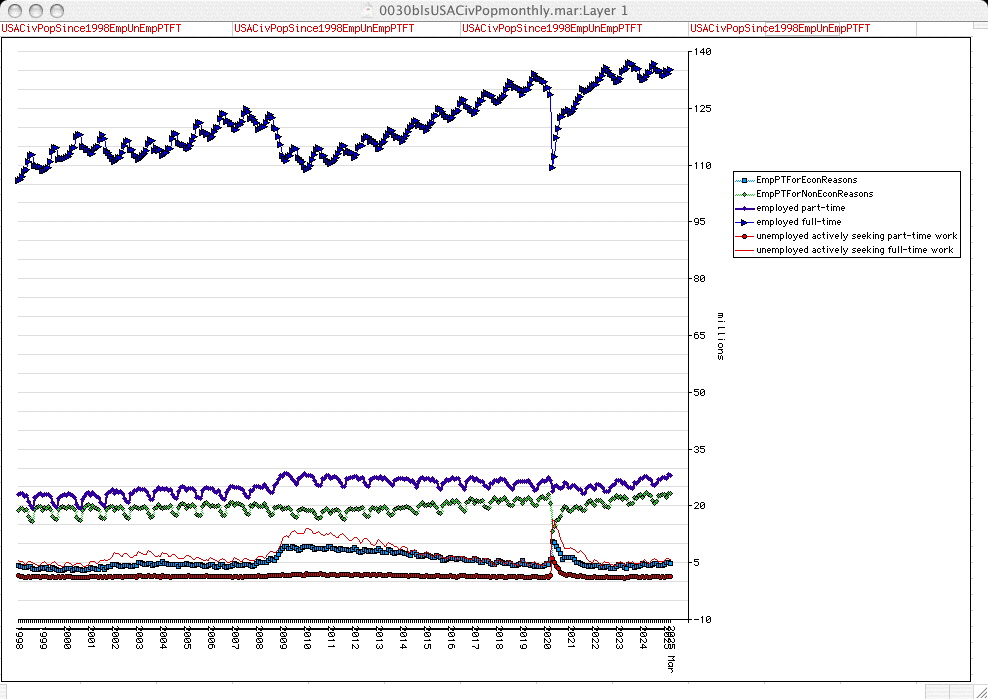
LNU02032194 (Employed Part-Time for Economic Reasons contrary to preferences)
LNU02005977 (Employed Part-Time for NonEconomic Reasons)
LNU03200000 (UEASPTW UnEmployed actively seeking part-time work)
LNU03100000 (UEASFTW UnEmployed actively seeking full-time work)
LNU02300001 (men 16+)
retrieved via https://data.bls.gov/series-report
USA Civ Pop components (since 1998) Employment, UnEmployment
USA Civ Pop components (since 1998) PT, FT
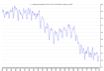
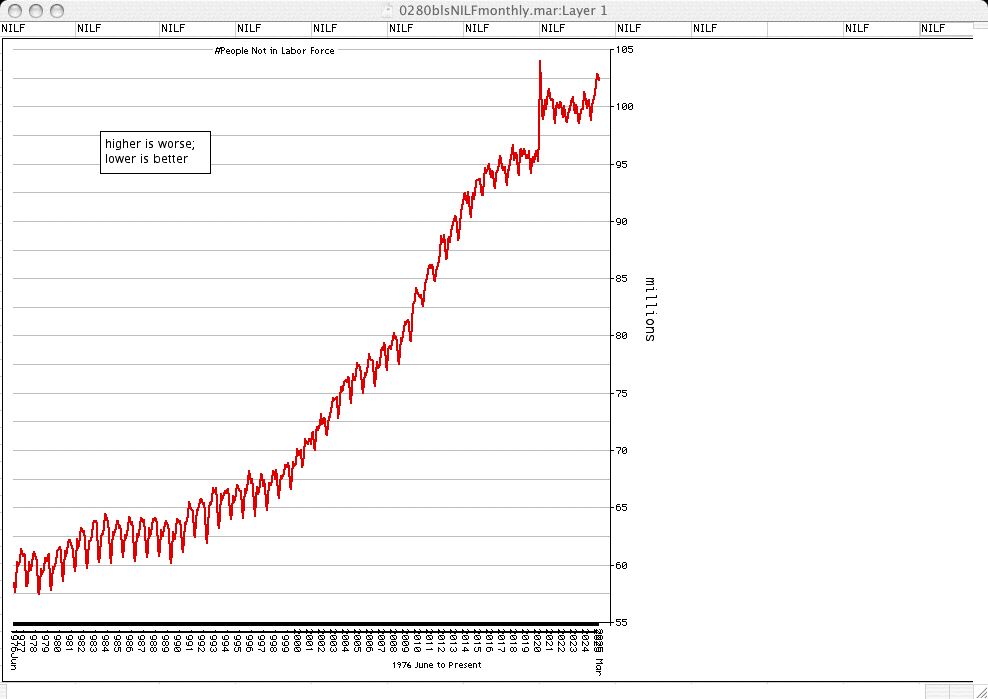
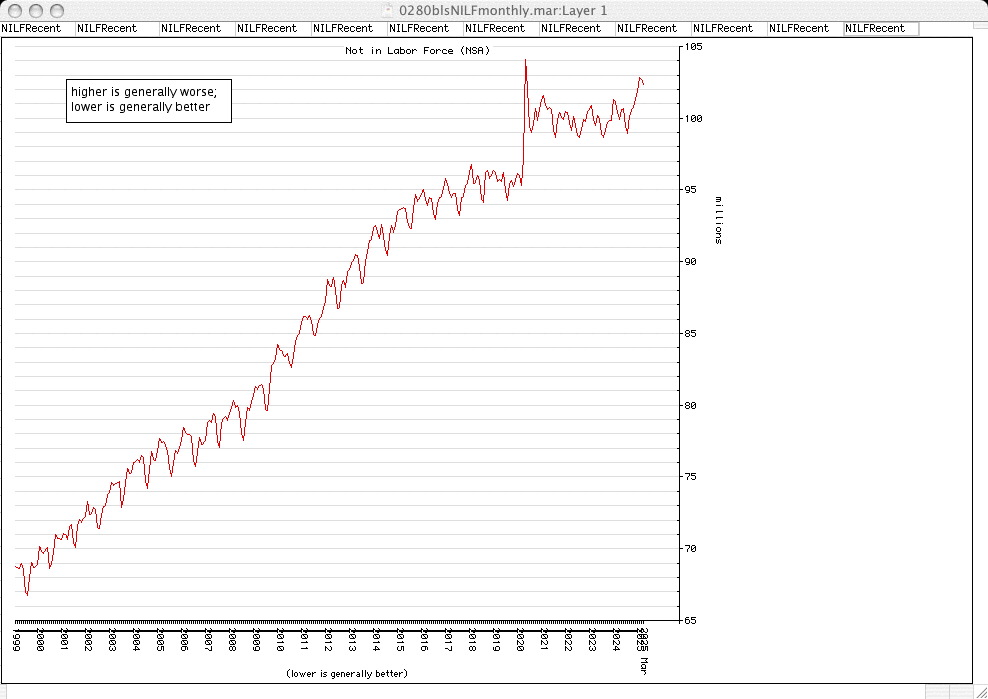
"Not in «Labor Force»" (NILF since 1976)
NILF (since 1999)
LNU05000000
retrieved from https://data.bls.gov/series-report
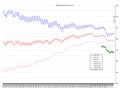
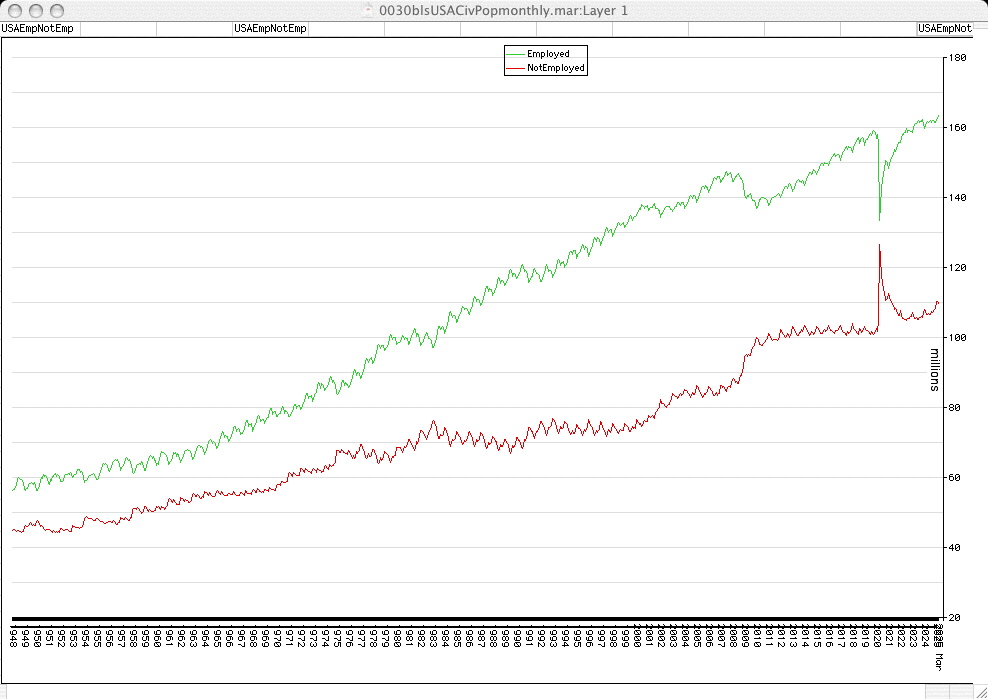
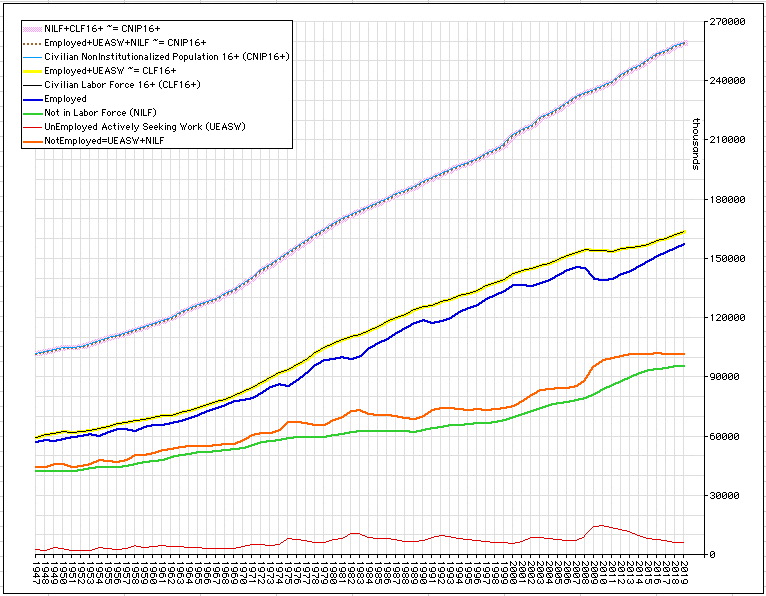
USA Number Employed & Number Not Employed since 1948
LNU02000000 (Employed)
LNU05000000 (NILF not in "labor force")
LNU03000000 (UEASW UnEmployed actively seeking work)
NILF + UEASW = Not Employed
USA Civ Pop components as ratios (percentages of USA Civilian Non-Institutionalized Working-Age Population) (since 1998)
(UEASW ÷ CivPop = U3 Unemployment Rate)
(Employed ÷ CivPop = employment rate = work rate)
Components of USA Civilian Non-Institutionalized Working-Age Population (annual)
LNU00000000
LNU01000000
LNU02000000
LNU05000000
LNU03000000
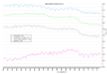
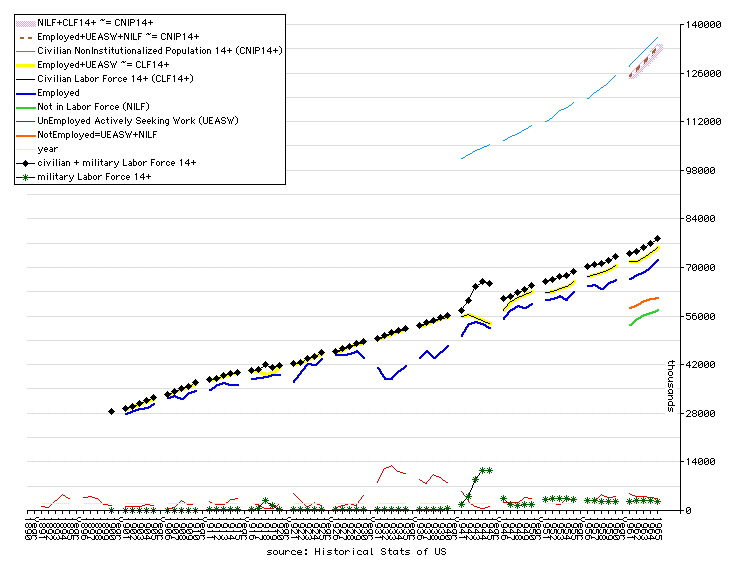
Components of USA Civilian Non-Institutionalized Working-Age Population (historical)
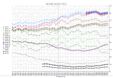
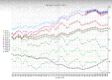
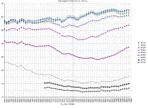
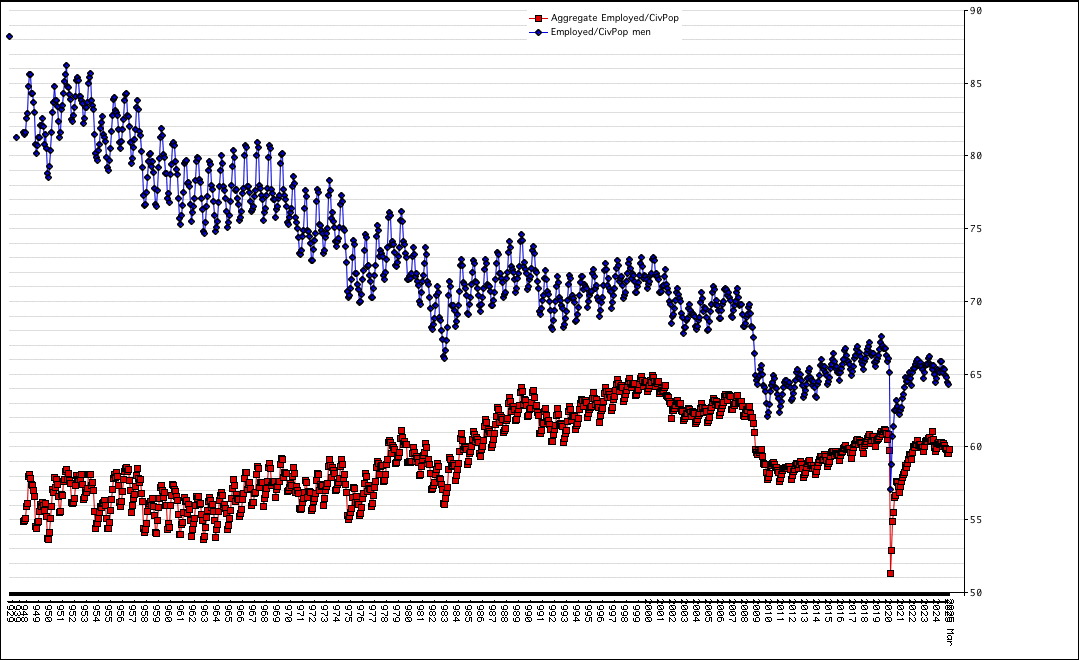
percentages of USA Civilian Non-Institutionalized Working-Age Population: percentages of Men employed have been falling while percentages of Women employed generally increased from 1929 to about 2000, since which both have been tending to fall and not fully recover during recoveries from recession under the practice of neo-Keynesian fiscal & monetary/currency actions
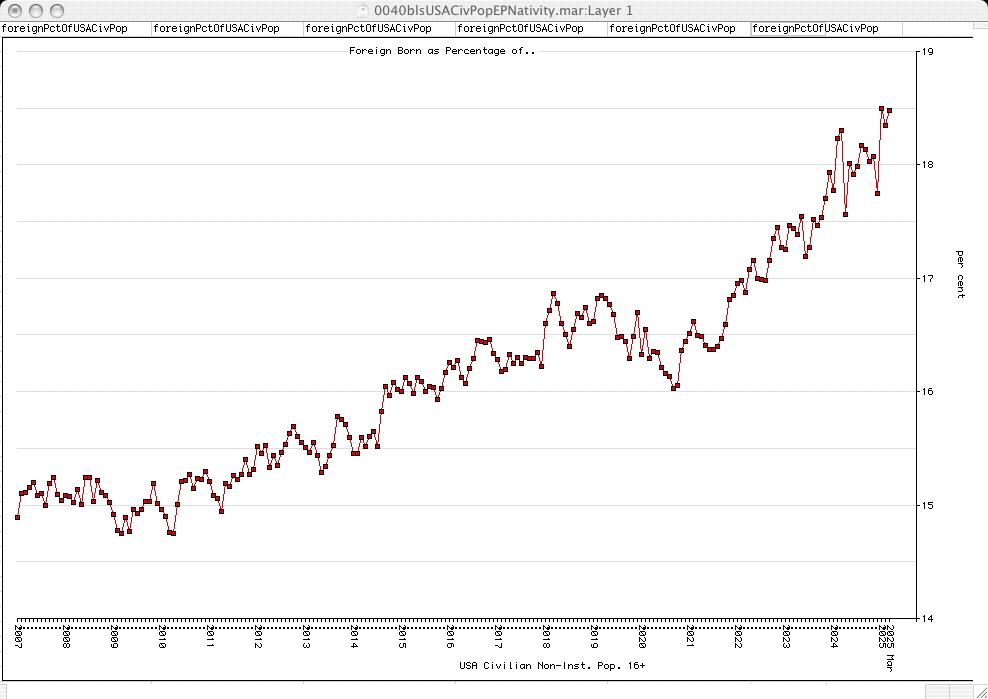
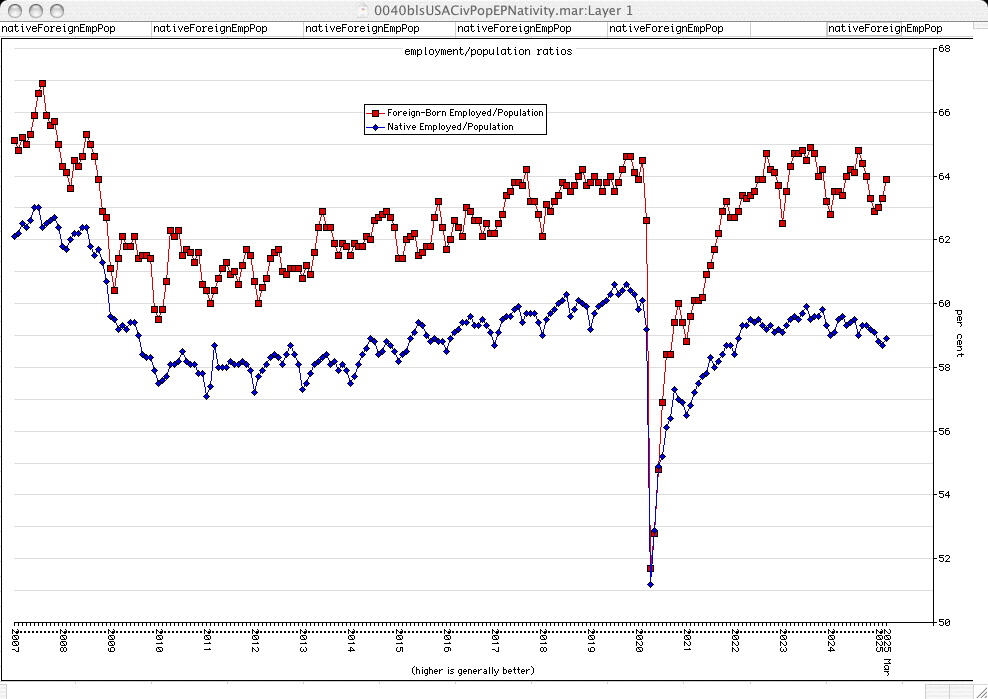
Native vs. Foreign-Born
Foreign Born as Percentage of US Civilian Non-Institutionalized Population 16+
LNU00073395 (Foreign-Born NICivPop16+)
LNU00073413 (Native NICivPop16+)
LNU00000000 (CivPop16+)
Native and Foreign Born Employment to Population ratios
LNU02373395 (Foreign-Born Employed/FBNICivPop16+)
LNU02373413 (Natives Employed/NativeNICivPop16+)
2022-06-01 (5782 Shivan 02)
Steven A. Camarota & Karen Zeigler _Center for Immigration Studies_
foreign-born population hit record 47M in 2022 April; increased 2M since 2021 January, driven largely by invaders (with graphs)
2024-06-19 (5784 Sivan 13)
Steven A. Camarota _Center for Immigration Studies_
the costs of invasion and other forms of illegal immigration
National Affairs
2025-03-12 (5782 Shivan 02)
Steven A. Camarota & Karen Zeigler _Center for Immigration Studies_
numbers of foreign-born and share of resident USA population at all-time highs in 2025 January: record increase in last 4 years driven primarily by illegal immigration (with graphs)
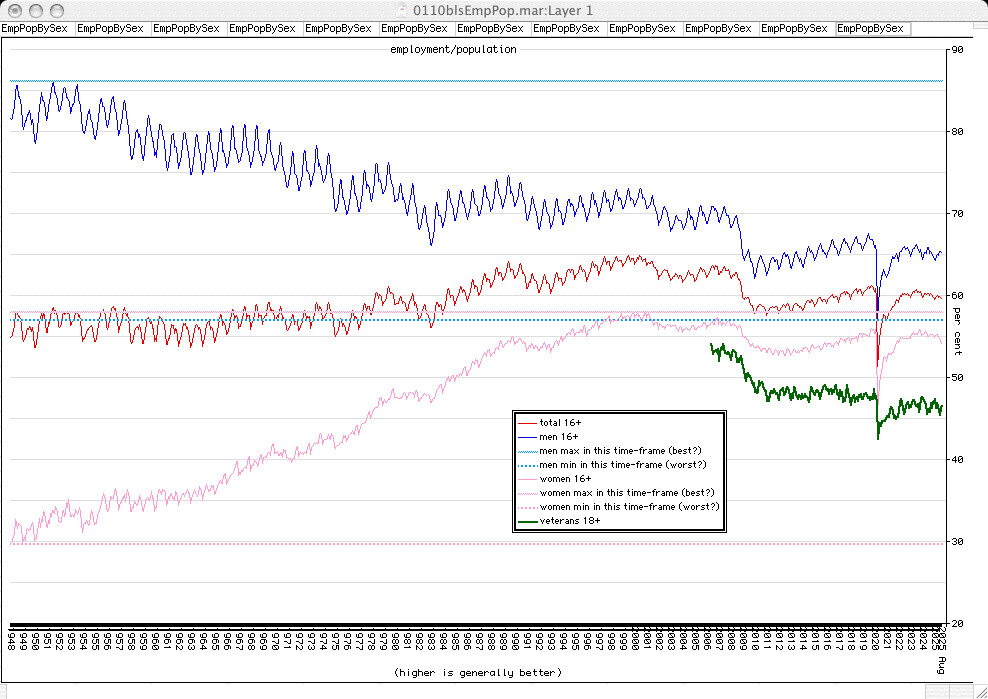
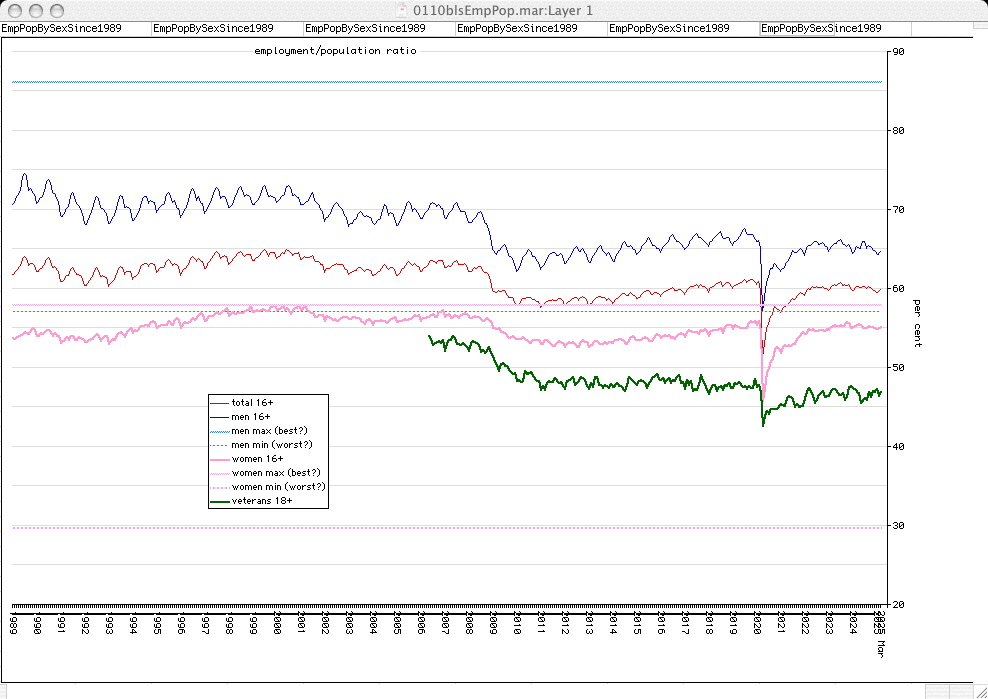
By Sex (+ Veterans)
ratios by sex (+ veterans) (data since 1948)
ratios by sex (+ veterans) since 1989
LNU02300000 (total 16+)
LNU02300001 (men 16+)
LNU02300002 (women 16+)
LNU02349526 (veterans 18+)
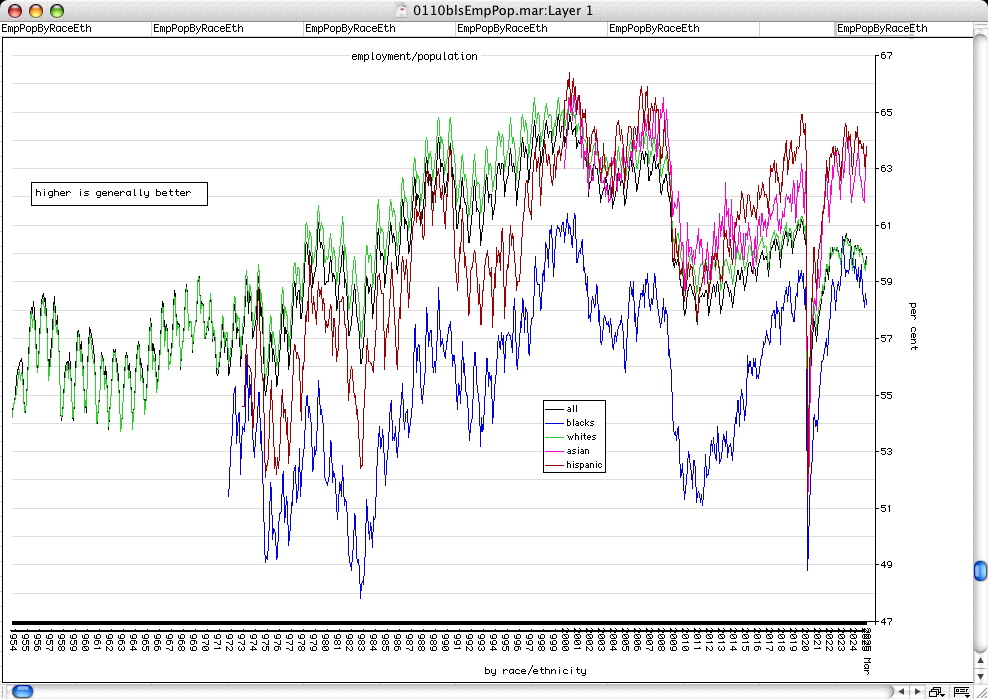
"Race" & Ethnicity
ratios by "race" & ethnicity (data since 1954)
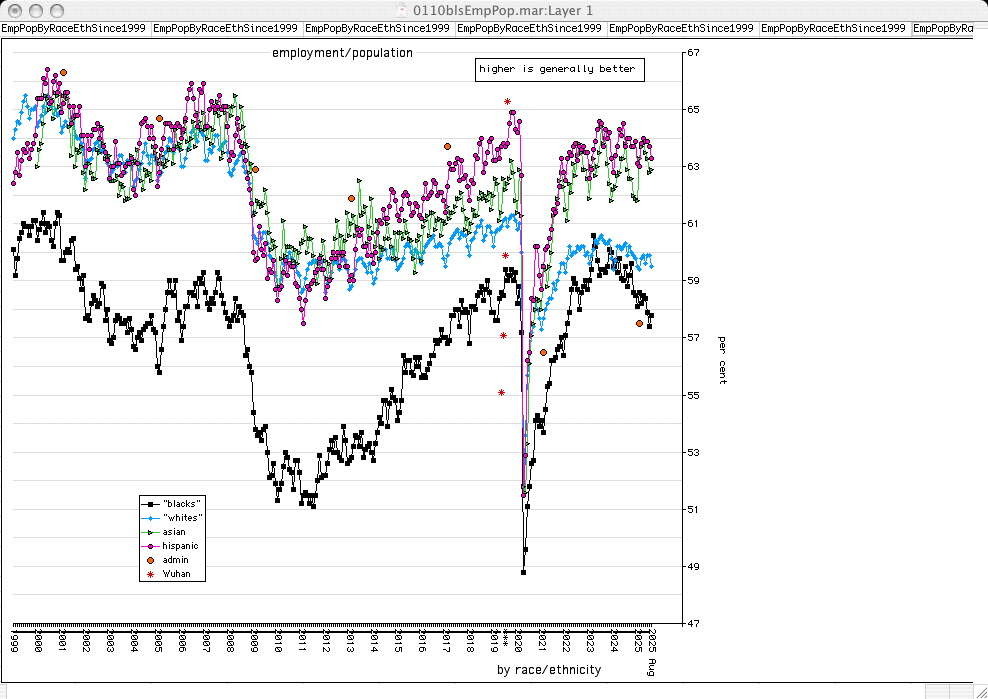
ratios by "race" & ethnicity since 1999
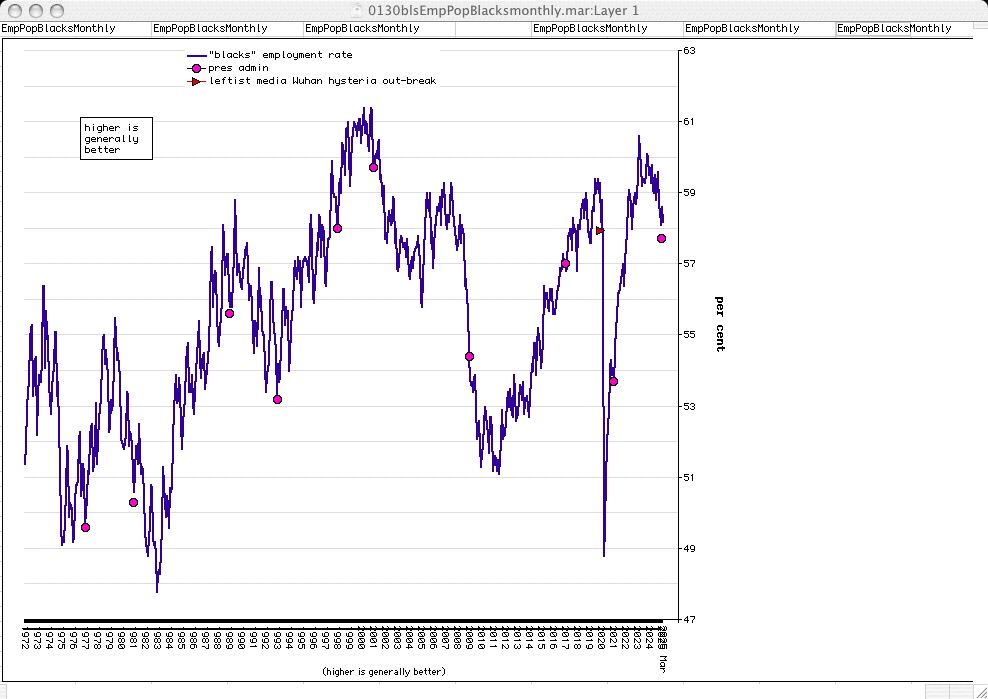
ratios for "blacks" since 1972
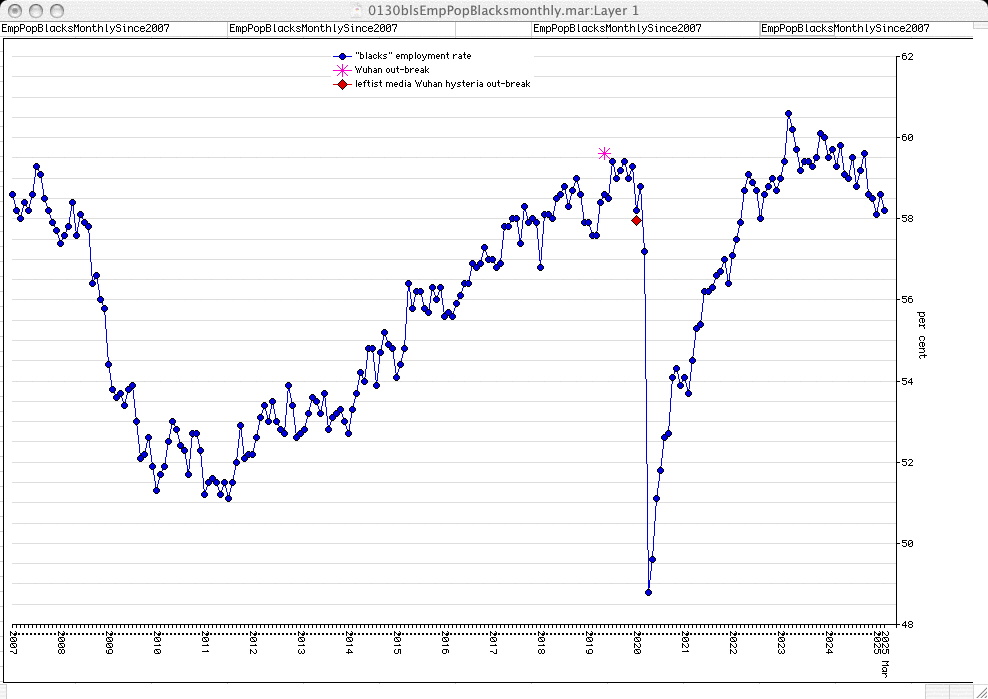
ratios for "blacks" since 2007
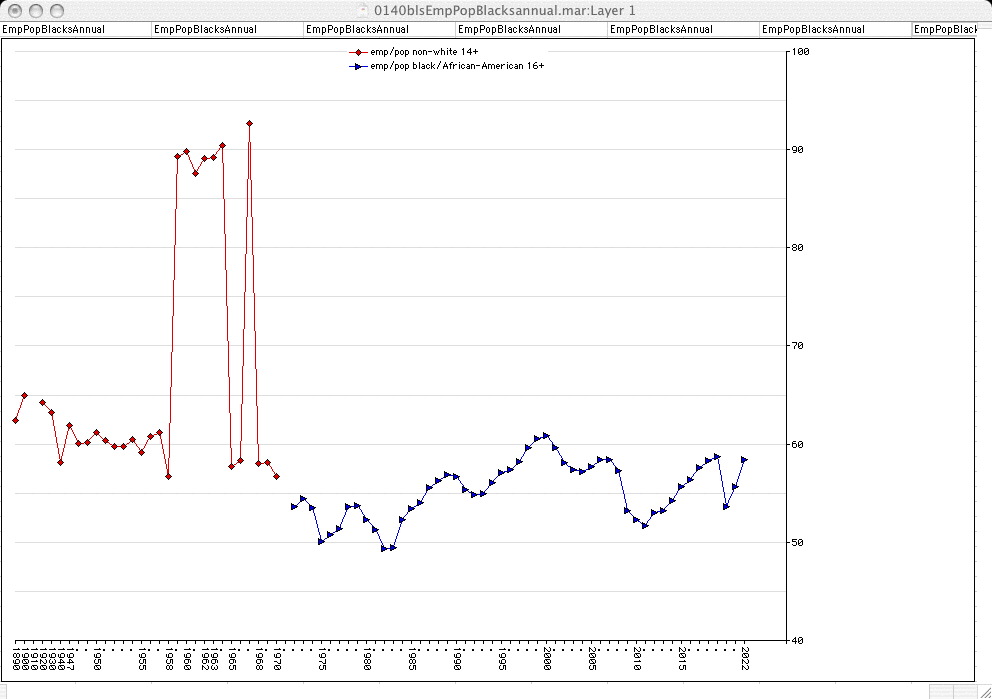
ratios for "blacks" (annual data since 1890)
LNU02300006 ("blacks")
LNU02300003 ("whites")
LNU02332183 ("asians")
LNU02300009 ("hispanic")
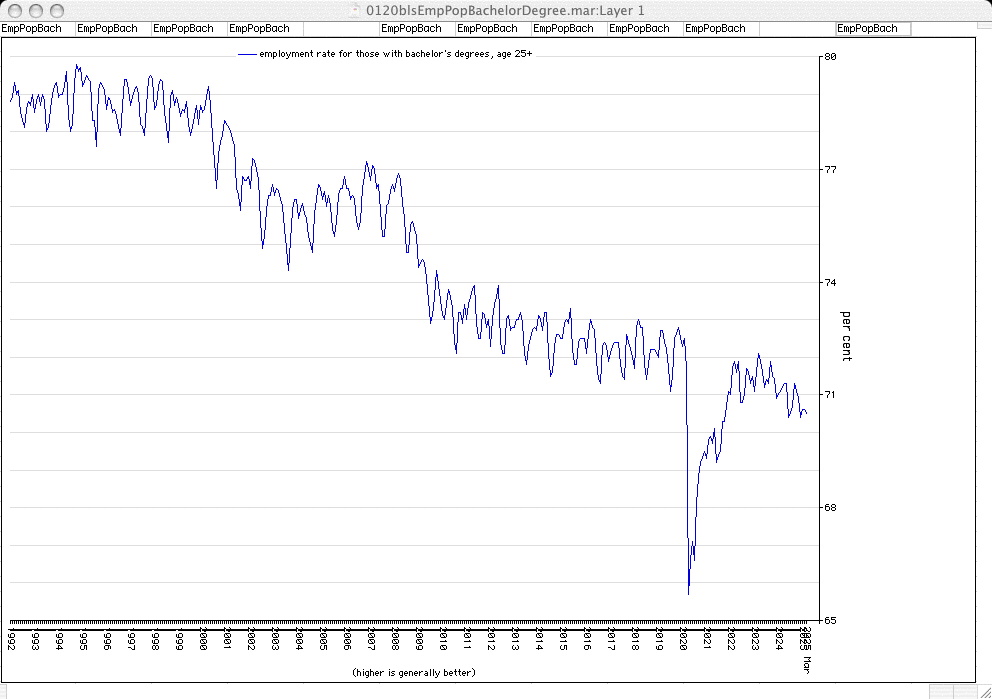
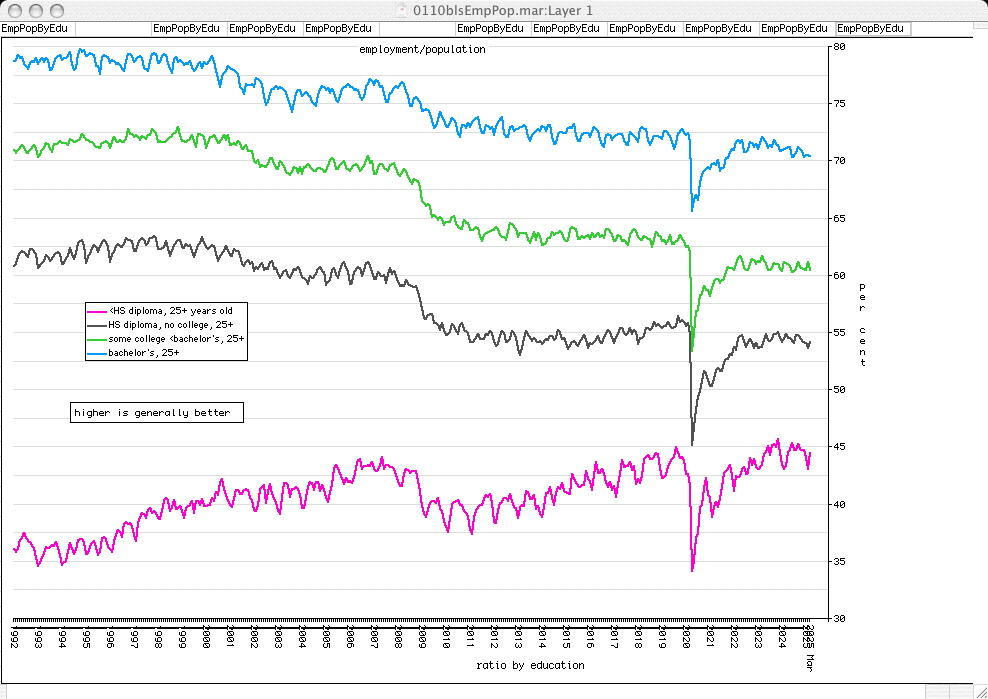
Education
ratios for those with bachelor's degree or equivalent (data since 1992)
ratios by education (data since 1992)
LNU02327659 (< HS diploma)
LNU02327660 (HS diploma, no college)
LNU02327689 (some college)
LNU02327662 (bachelor's)
men employment rates by academic credential from 1992:
LNU02327675
LNU02327676
LNU02327693
LNU02327677
LNU02327687
LNU02327678
LNU02392226
LNU02391114
men employment rates by academic credential from 1992
women employment rates by academic credential from 1992:
LNU02327679
LNU02327680
LNU02327694
LNU02327681
LNU02327688
LNU02327682
LNU02392231
LNU02391115
women employment rates by academic credential from 1992
retrieved from https://data.bls.gov/series-report
Age Ranges
ratios by age ranges: there is a glitch with accessing the data via the "Date Retrieel Tools > Series Report" interface, and a small glitch in one item of data. It is unresponsive, so it may take a few days to get these data & graphs updated with the 2023 September figures.
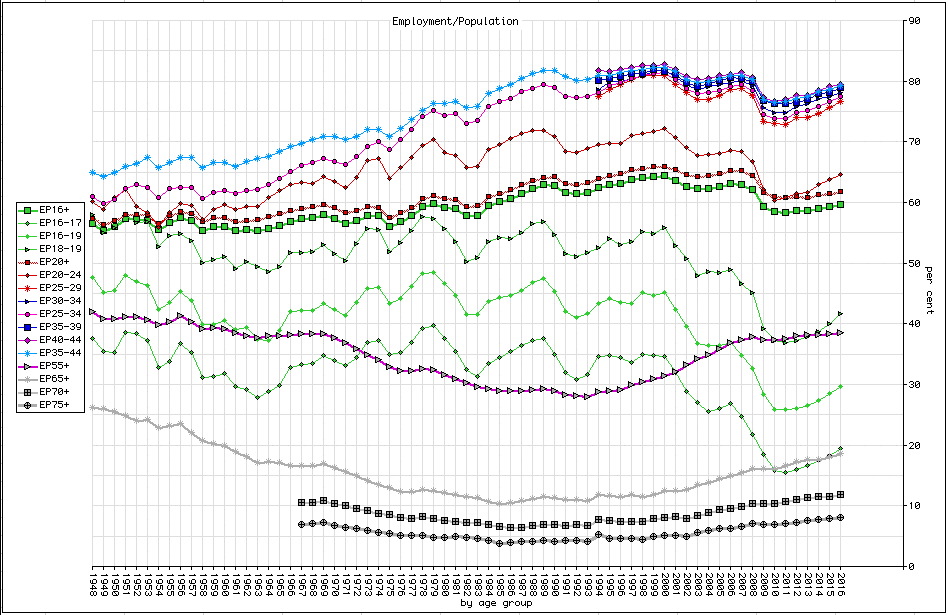
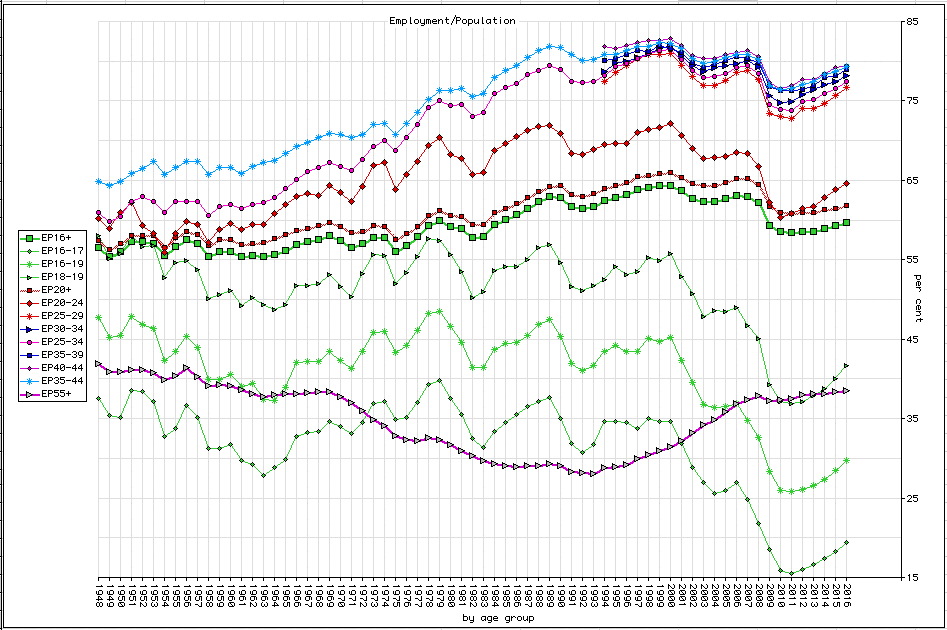
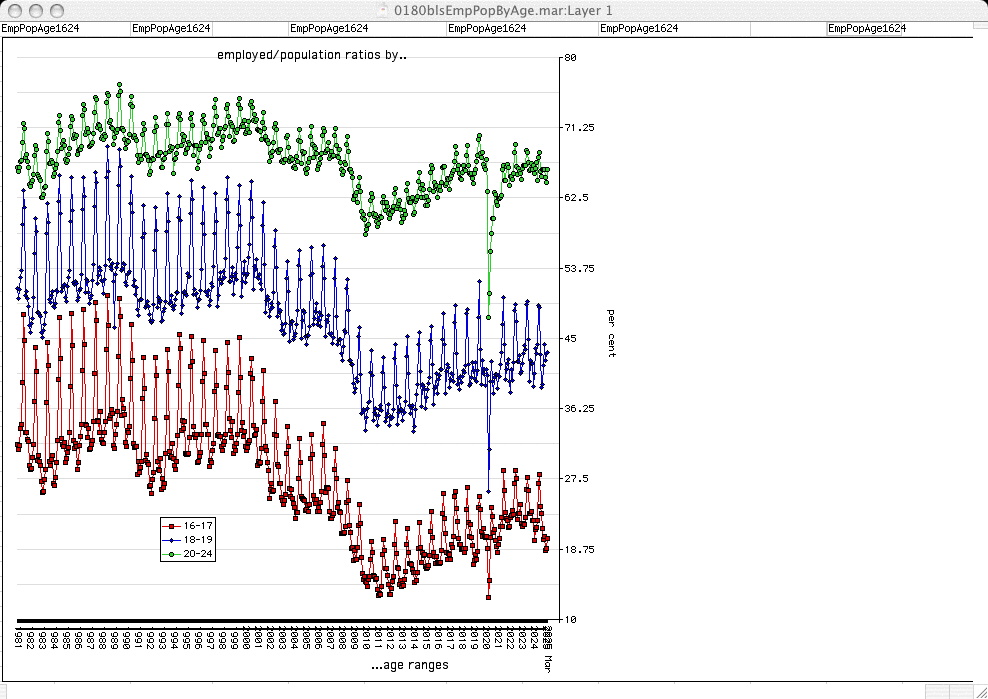
ratios by age ranges (16-17, 18-19, 20-24) (data since 1981)
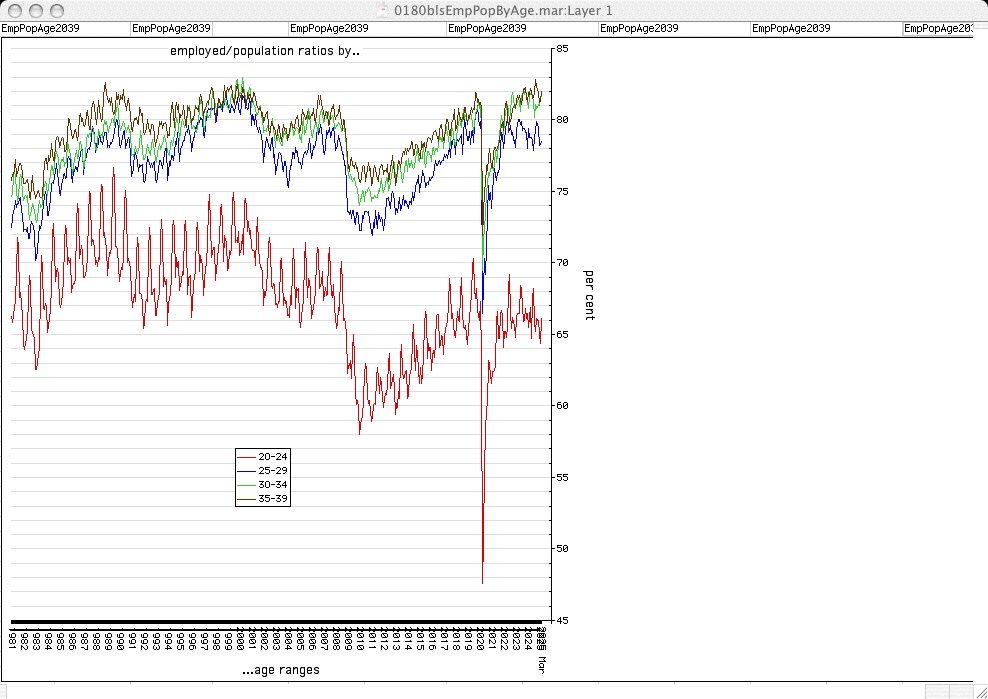
ratios by age ranges (20-24, 25-29, 30-34, 35-39) (data since 1981)
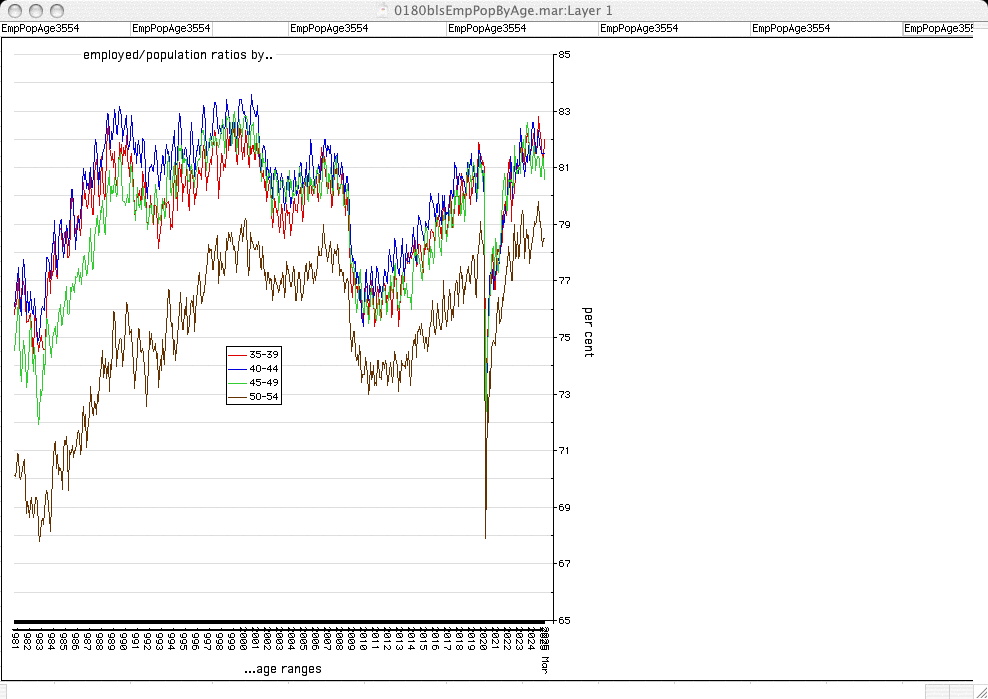
ratios by age ranges (35-39, 40-44, 45-49, 50-54) (data since 1981)
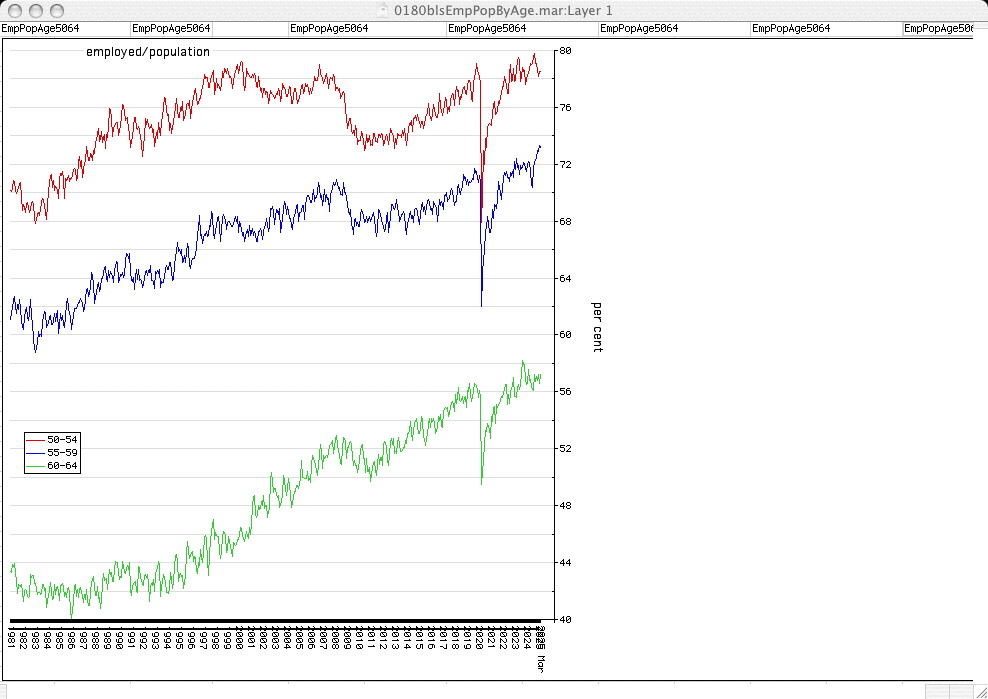
ratios by age ranges (50-54, 55-59, 60-64) (data since 1981)
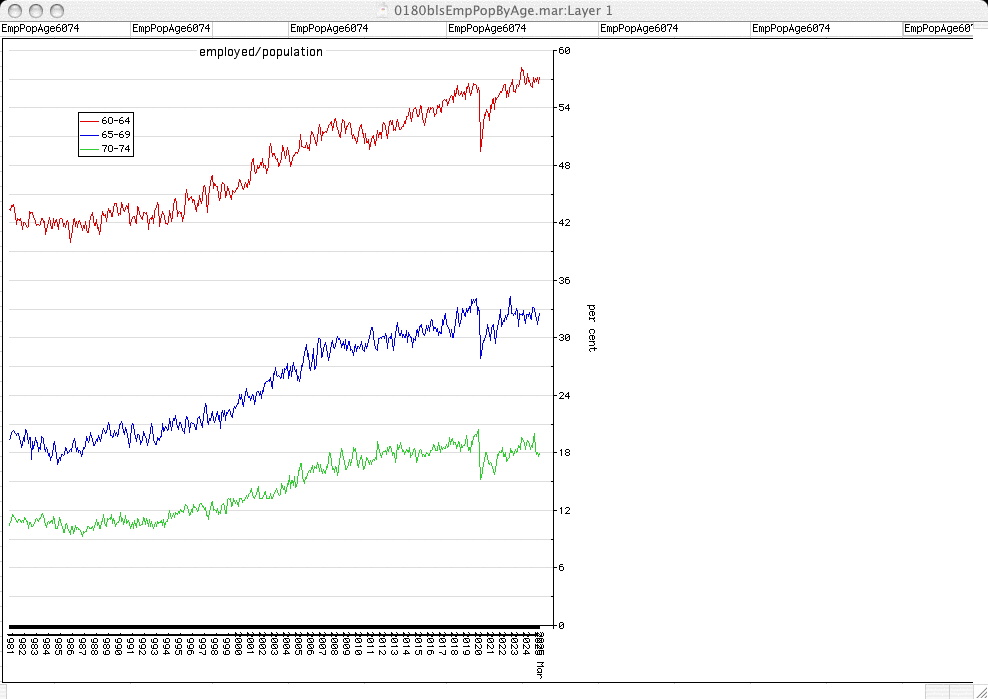
ratios by age ranges (60-64, 65-69, 70-74) (data since 1981)
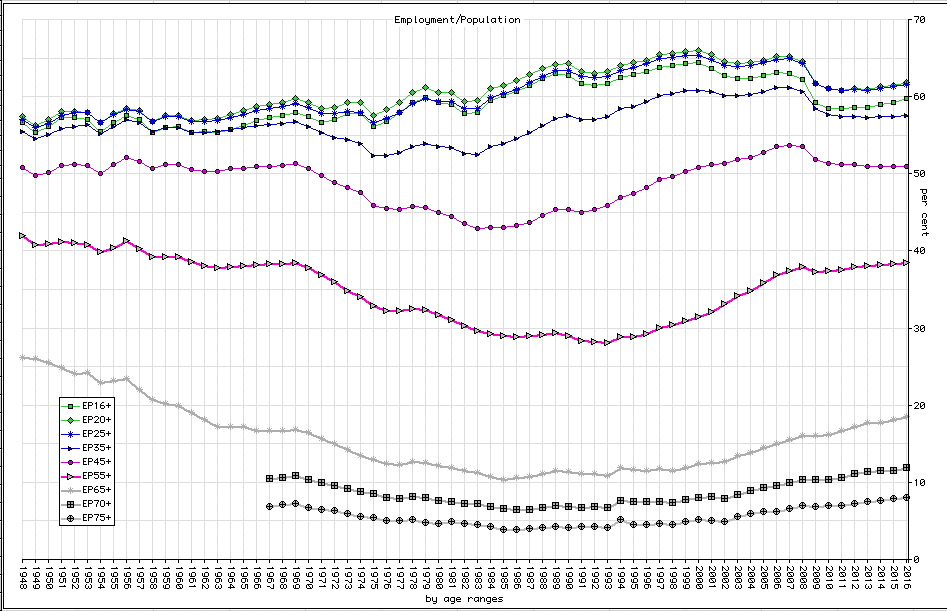
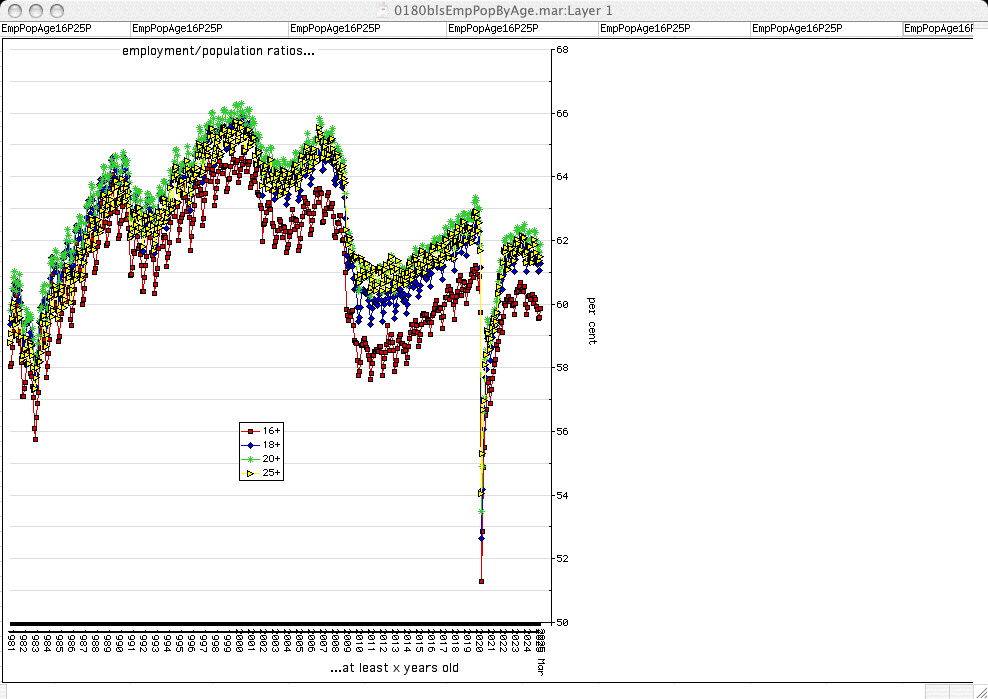
ratios by age ranges (16+, 18+, 20+, 25+) (data since 1981)
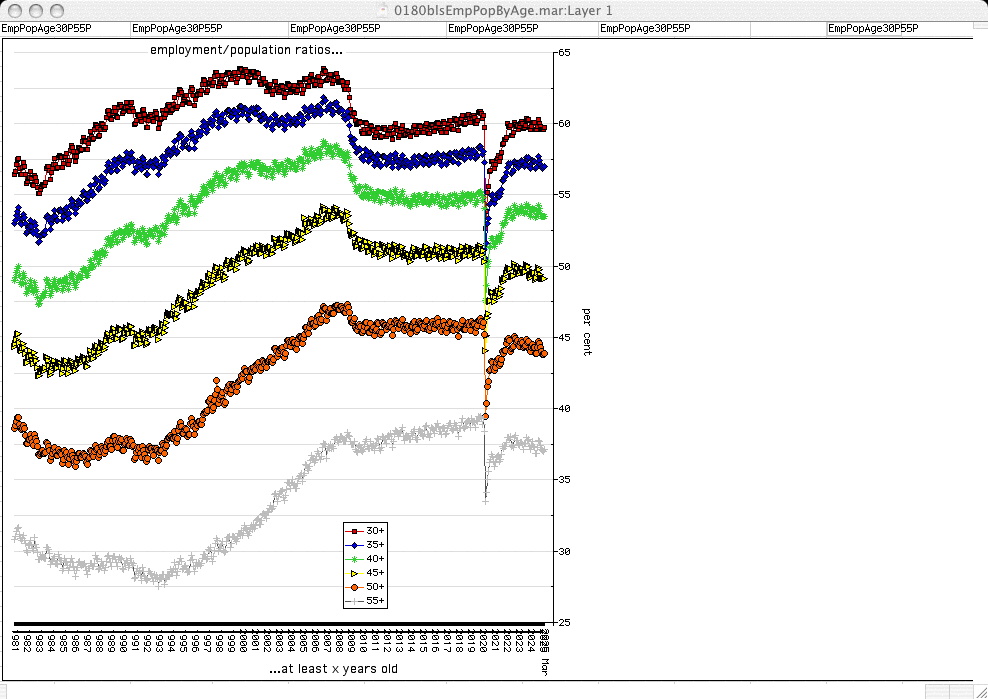
ratios by age ranges (30+, 35+, 40+, 45+, 50+, 55+) (data since 1981)
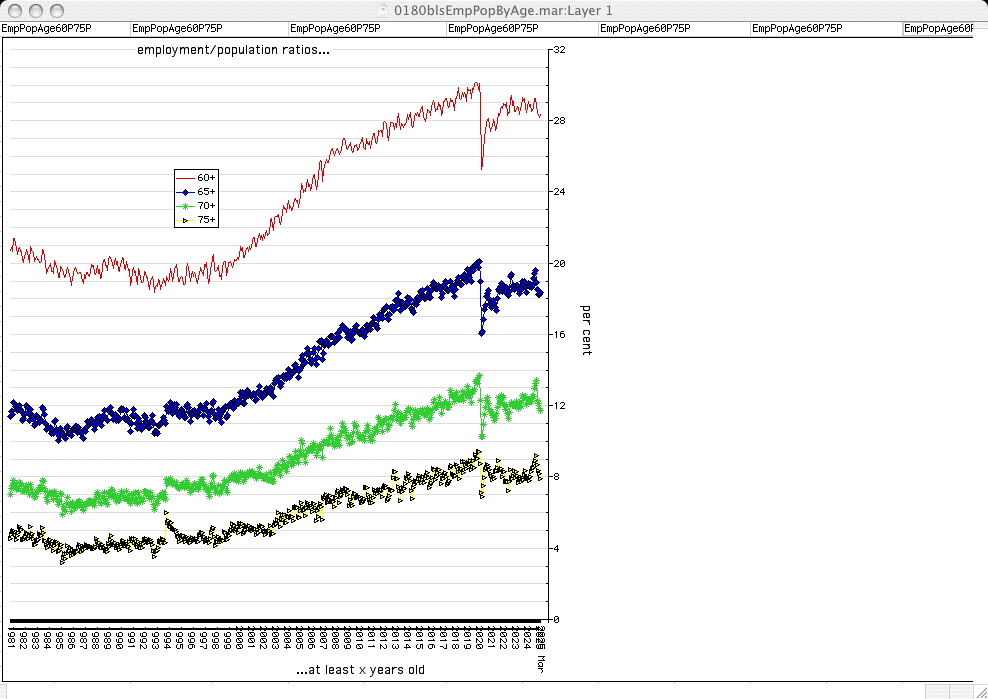
ratios by age ranges (60+, 65+, 70+, 75+) (data since 1981)
The above were generated using or derived from the following BLS LabStat data series:
population
LNU00000000 (16+)
LNU00000024 (20+)
LNU00000048 (25+)
LNU00000092 (45+)
LNU00024230 (55+)
LNU00000097 (65+)
LNU00024942 (75+)
LNU00000086 (16-17)
LNU00000088 (18-19)
LNU00000036 (20-24)
LNU00024932 (25-29)
LNU00024933 (30-34)
LNU00024934 (35-39)
LNU00024935 (40-44)
LNU00024936 (45-49)
LNU00024937 (50-54)
LNU00000094 (55-59)
LNU00000096 (60-64)
LNU00024938 (65-69)
LNU00024941 (70-74)
employed
LNU02000000 (16+)
LNU02000024 (20+)
LNU02000048 (25+)
LNU02000092 (45+)
LNU02024230 (55+)
LNU02024942 (75+)
LNU02000086 (16-17)
LNU02000088 (18-19)
LNU02000036 (20-24)
LNU02024932 (25-29)
LNU02024933 (30-34)
LNU02024934 (35-39)
LNU02024935 (40-44)
LNU02024936 (45-49)
LNU02024937 (50-54)
LNU02000094 (55-59)
LNU02000096 (60-64)
LNU02024938 (65-69)
LNU02024941 (70-74)
employed/population ratios supplied by BLS to cross-check with calculations
LNU02300000 (16+)
LNU02300024 (20+)
LNU02300048 (25+)
LNU02300092 (45+)
LNU02324230 (55+)
LNU02300097 (65+)
LNU02324942 (75+)
employed/population ratios supplied by BLS
LNU02300086 (16-17)
LNU02300088 (18-19)
LNU02300036 (20-24)
LNU02324932 (25-29)
LNU02324933 (30-34)
LNU02324934 (35-39)
LNU02324935 (40-44)
LNU02324936 (45-49)
LNU02324937 (50-54)
LNU02300094 (55-59)
LNU02300096 (60-64)
LNU02324938 (65-69)
LNU02324941 (70-74)
https://data.bls.gov/series-report
I've ceased updating the following 3:
ratios by age ranges (data since 1948)
ratios by age ranges (data since 1948)
ratios by age ranges (data since 1948)
see also jobs dearth
Definitions & Descriptions:
Abbreviations: (skip)
CivPop = CNIP16+ =
- civilian, non-institutionalized population 16 years old & older = employed + not-employed = employed + UEASW + NILF CLF16+ + NILF
UEASW =
- unemployed and actively seeking work
CLF16+ =
- civilian labor force 16 years old & older = employed + unemployed and actively seeking work = employed + UEASW
NILF =
- not in labor force = not employed and not actively seeking work
unemployment rate = U3 =
- the percentage UEASW/CLF16+ * 100 (this is the most commonly reported indicator)
not-employed =
- NILF + UEASW
EmpPT =
- employed part-time
EmpFT =
- employed full-time
EmpPTForNonEconReasons =
- employed part-time for non-economic reasons (i.e. part-time work was freely chosen as a personal preference and not because full-time jobs are not available)
EmpPTForEconReasons =
- employed part-time for economic reasons (i.e. full-time jobs are not available or workable due to financial/economic constraints)
Emp/Pop = Emp/Pop ratio or percentage =
- numbers in category who are employed as per cent of civilian population for the category = number employed / civilian non-institutionalized population for the category * 100 (where category can be age range, sex, race/ethnicity, occupation, industry, education level, citizen, non-citizen, native, foreign-born...)
Discouraged =
- Not in Labor Force, Searched For Work (within last 12 months, but not this month) and Available, Discouraged with Reasons For Not Currently Looking
Marginally Attached =
- Not in Labor Force, Searched For Work (within last 12 months, but not this month) and Available
LFPR =
- labor force participation rate(s) = (UEASW+employed)/CNIP (for category)
dearth =
- scarcity, lack, dear, shortage, insufficiency, inadequate supply of jobs
--- historical ---
CNIP14+ =
- civilian, non-institutionalized population 14 years old & older
CLF14+ =
- civilian labor force 14 years old & older = employed + unemployed and actively seeking work
Civilian, non-institutionalized population, 16 years and older (WickedPedia)
glossary (BLS)
e-mail jgo
(ottO .G nhoJ)
External links may expire at any time.
Neither this page, nor the opinions expressed or implied in it are endorsed by Michael Badnarik, Ron Paul, Binyamin L. Jolkovsky, Bob Barr, Walter E. Williams, Wayne Allyn Root, Thomas Sowell, Warner Brothers, Gary Johnson, Peter Brimelow, president Donald Trump, nor by my hosts, Kermit and Rateliff.
Page Top

