Employment/Unemployment Data
plug: graphs prepared using Mariner Calc, Grab, & Preview
updated: 2026-01-18
| |
"Res ipsa loquitur."
(The facts speak for themselves.)
| |
jump to definitions of specialized terms
Graphs Related to Employment, UnEmployment, and Earnings
(from BLS data except where noted)
table of most recent (BLS)
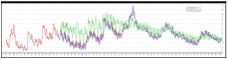
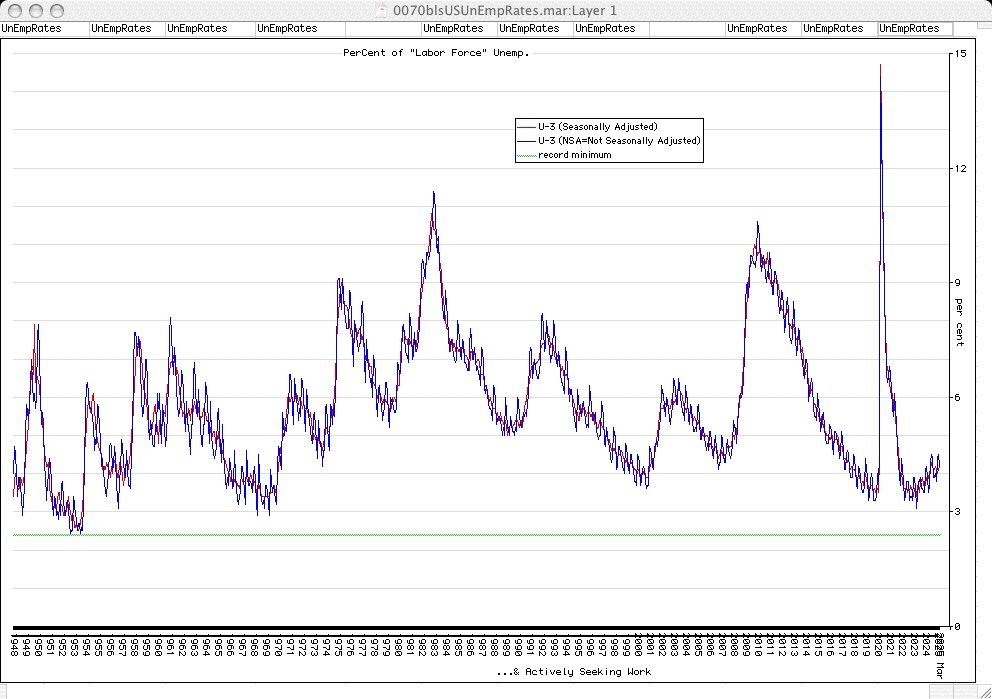
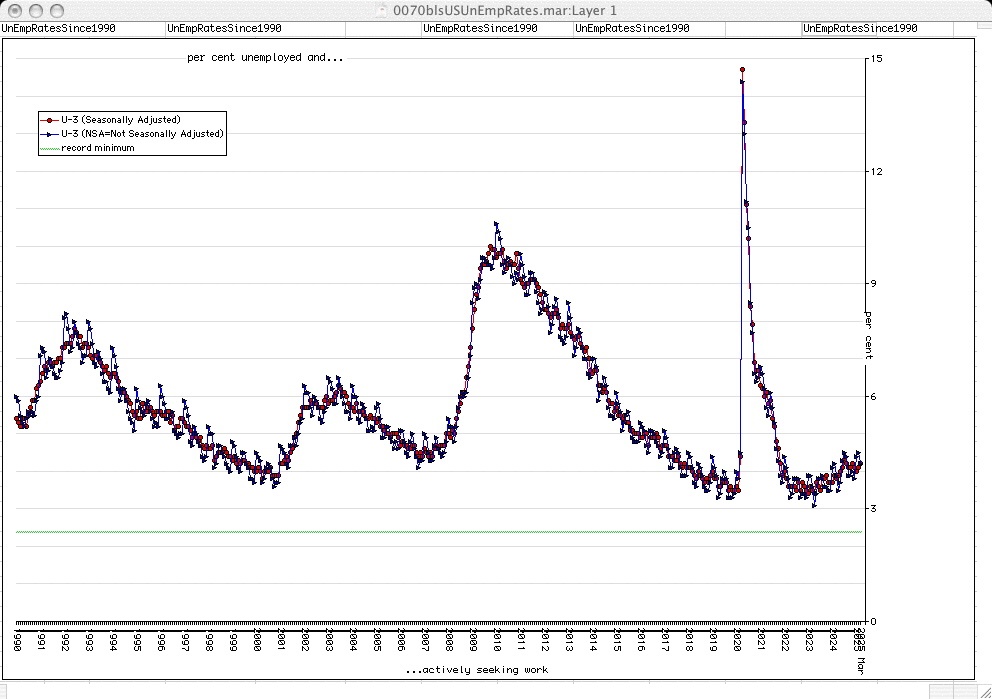
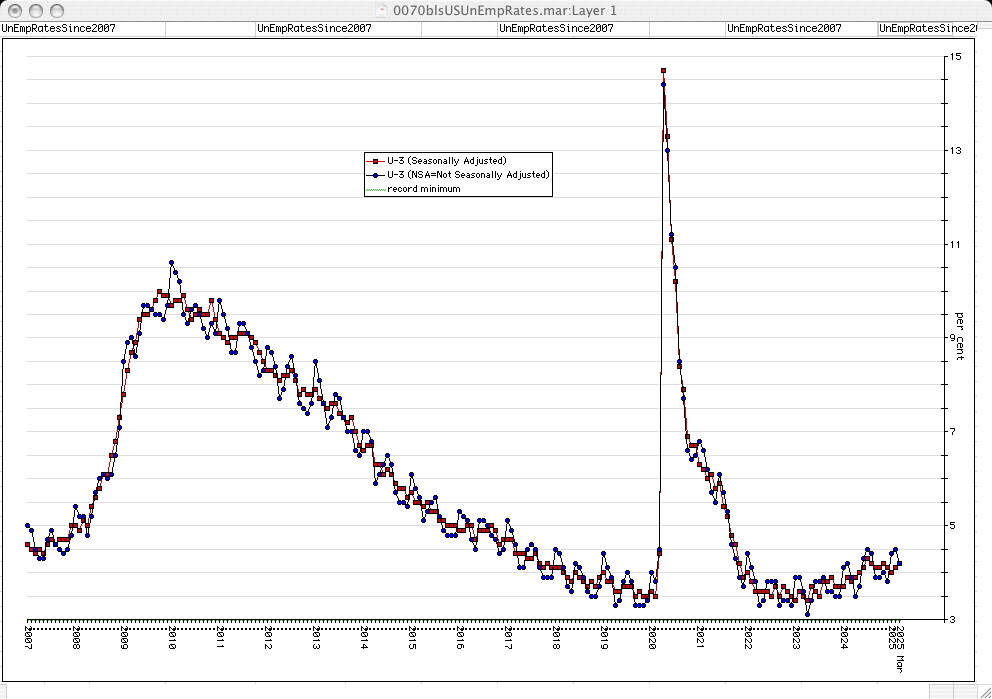
Unemployment Rates (U3: seasonally adjusted and NOT seasonally adjusted)
Unemployment Rates
Unemployment Rates (seasonally adjusted and not, since 1990)
Unemployment Rates (since 2007)
LNS14000000 (seasonally adjusted)
LNU04000000 (not seasonally adjusted)
retrieved from https://data.bls.gov/series-report
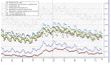
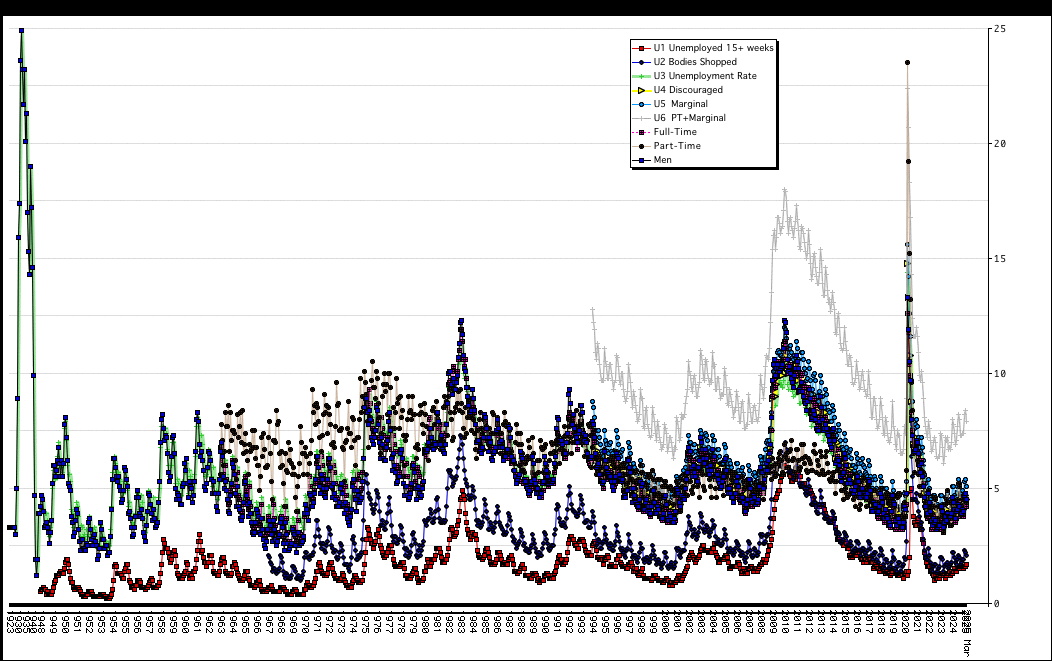
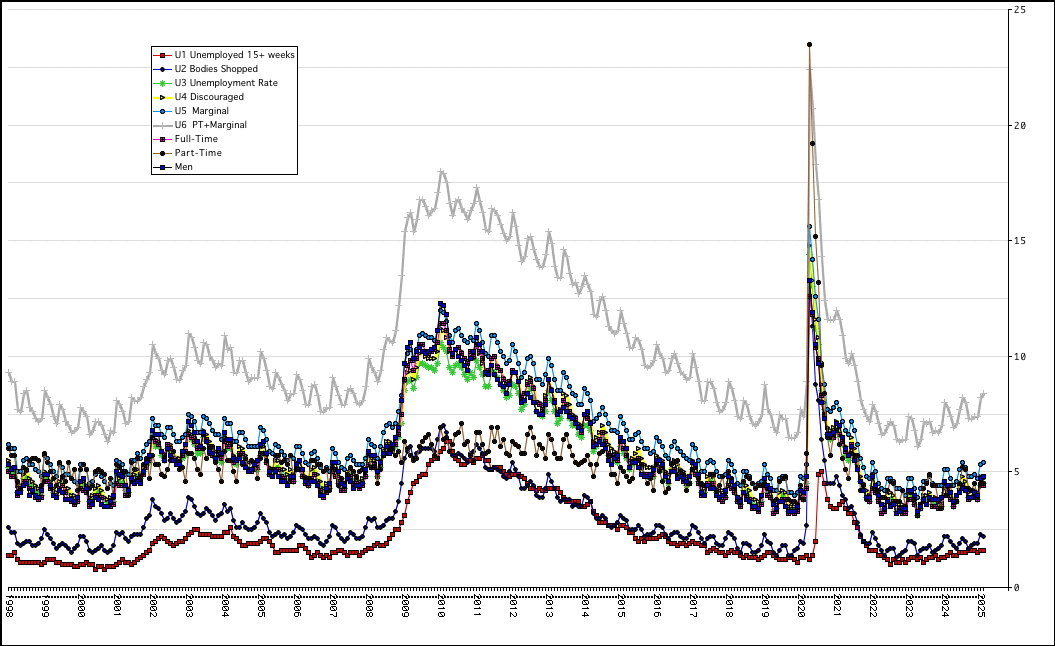
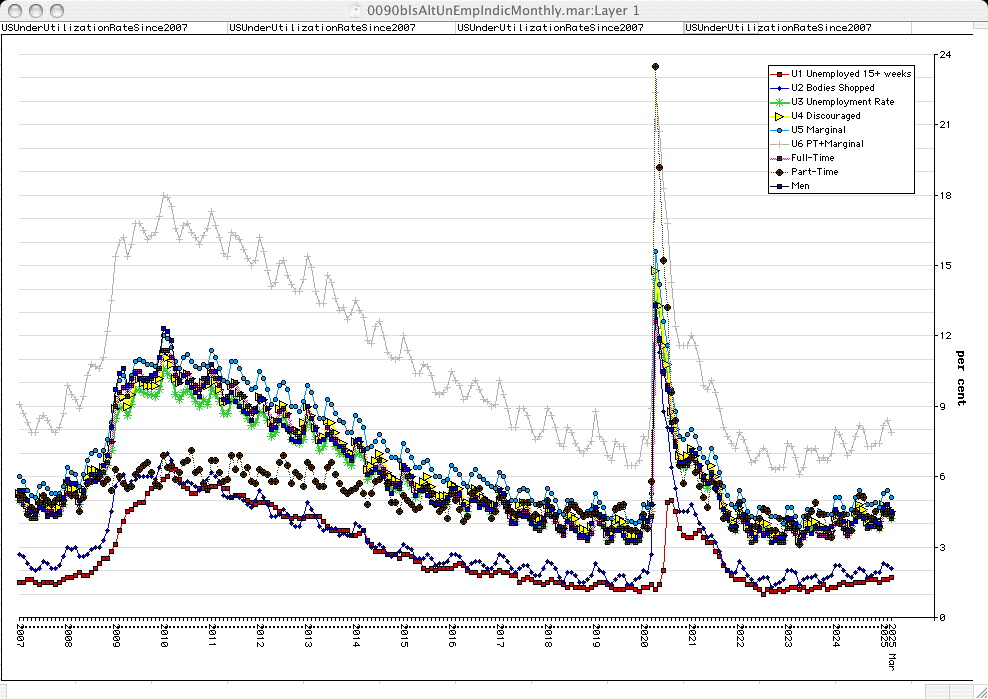
alternative unemployment rates (U1-U6, FT, PT, men)

USA UnEmployment/ UnderUtilization Rates
USA UnEmployment/ UnderUtilization Rates since 2007
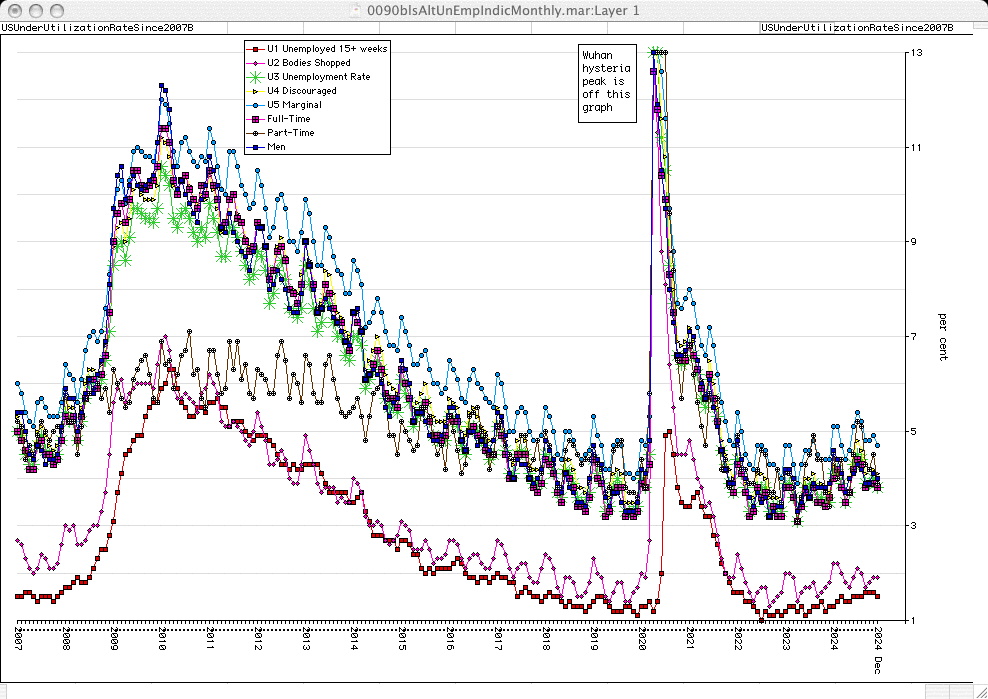
USA UnEmployment/ UnderUtilization Rates since 2007 clipped
USUnderUtilizationRateSince2007B
LNU03025670 (U1)
LNU04023621 (U2)
LNU04000000 (U3)
LNU03327707 (U4)
LNU03327708 (U5)
LNU03327709 (U6)
LNU04100000 (seeking full-time work)
LNU04200000 (seeking part-time work)
LNU04000001 (men)
2024-05-05: Deleted USUnderUtilizationRate2.jpg & USUnderUtilizationRate2Since2007.jpg, & brought LNU04000001 (men) into the 3 above.
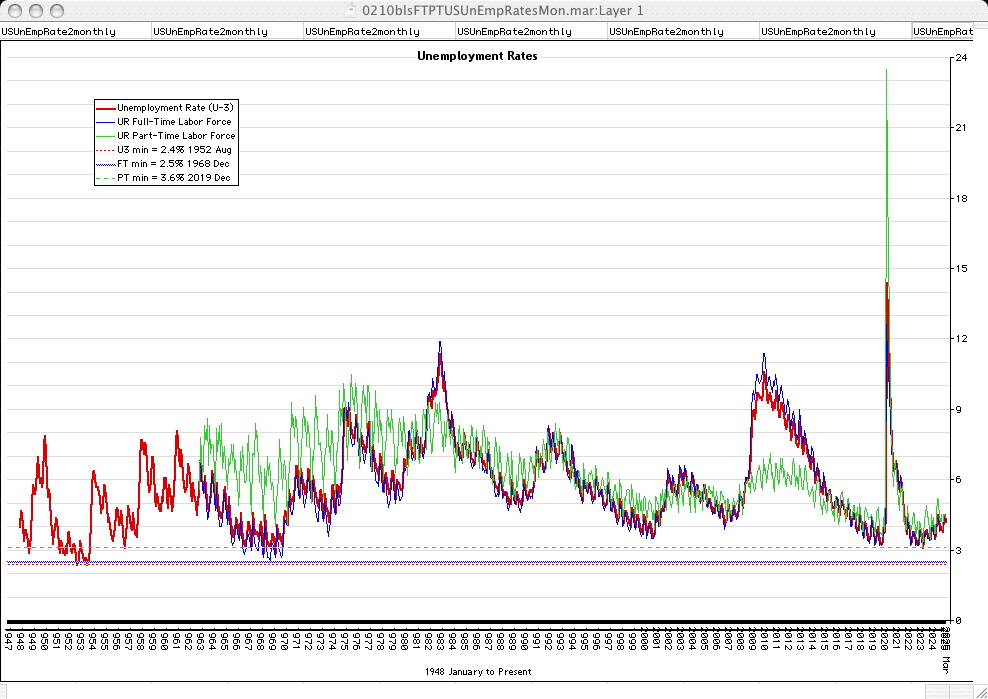
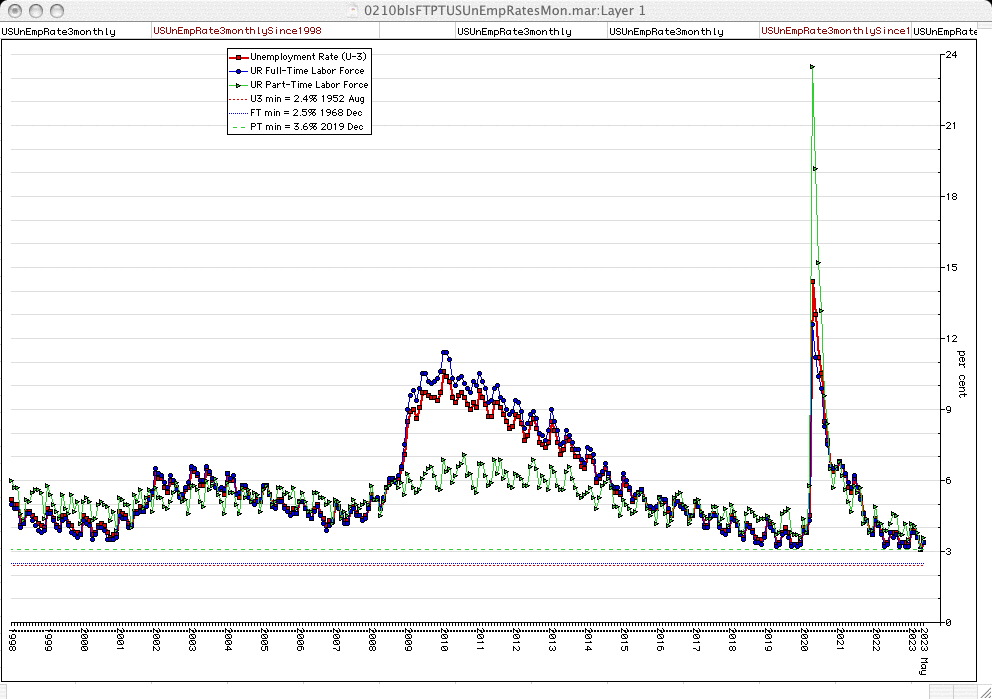
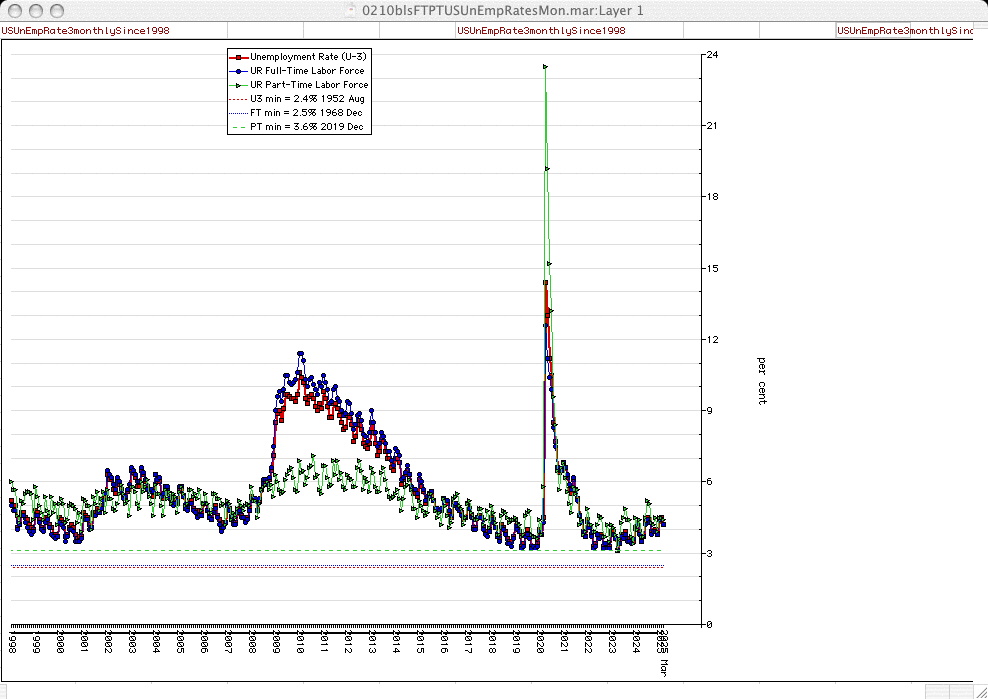
USA FT, PT UnEmployment Rates: since 1998
USA FT, PT UnEmployment Rates: since 1998
since 1998
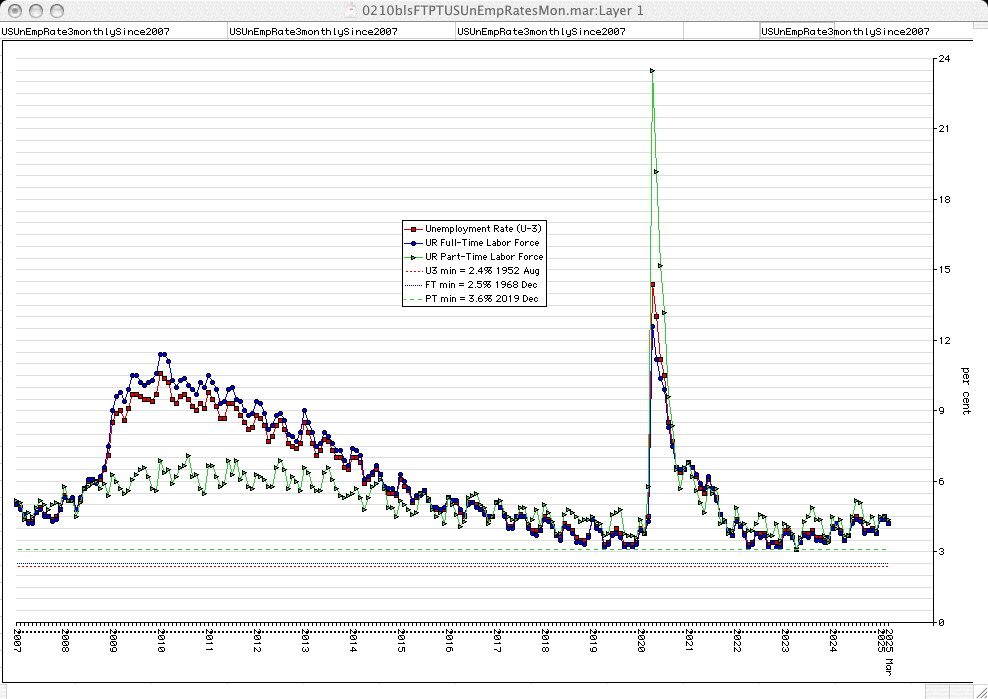
since 2007
alternate USA UnEmployment Rates: since 1998
alternate USA UnEmployment Rates: since 2007
alternate USA UnEmployment Rates annual
LNU03025670 (U1)
LNU04023621 (U2)
LNU04000000 (U3)
LNU03327707 (U4)
LNU03327708 (U5)
LNU03327709 (U6)
LNU04100000 (seeking full-time work)
LNU04200000 (seeking part-time work)
LNU04000001 (men)
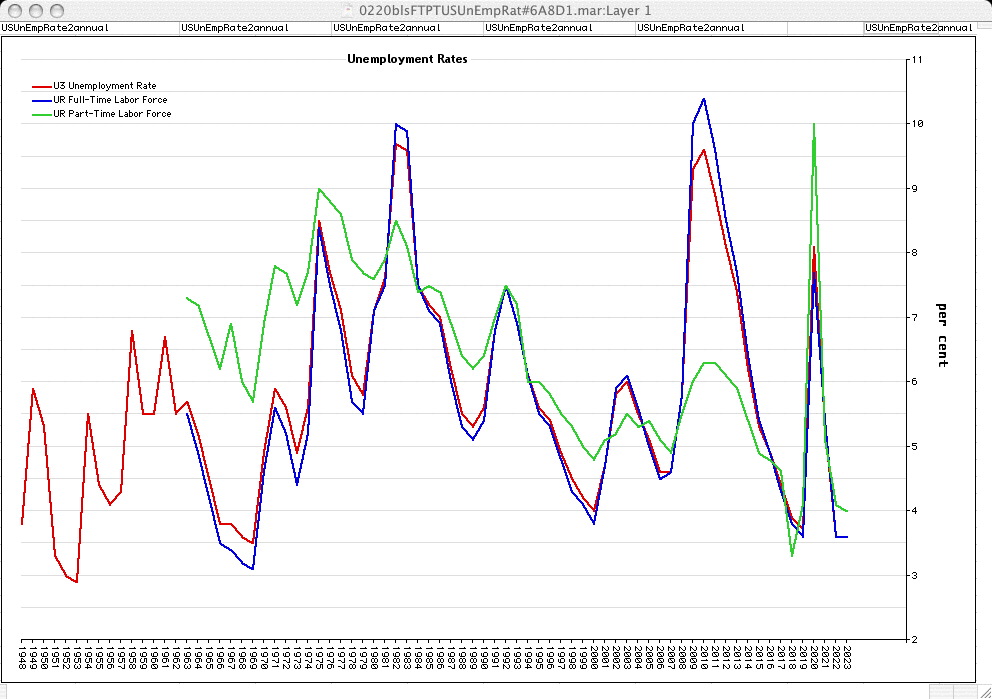
alternate USA UnEmployment Rates, seeking any work, FT, PT since 1948
LNU04000000 (U3: unemployed & actively seeking work: min 1952 Aug = 2.4%)
LNU04100000 (unemployed & actively seeking full-time work: min 1968 Dec = 2.5%)
LNU04200000 (unemployed & actively seeking part-time work: min 2019 Dec = 3.6%)
alternate USA UnEmployment Rates U-3, FT, PT (with minimum, average, maximum since 1948)
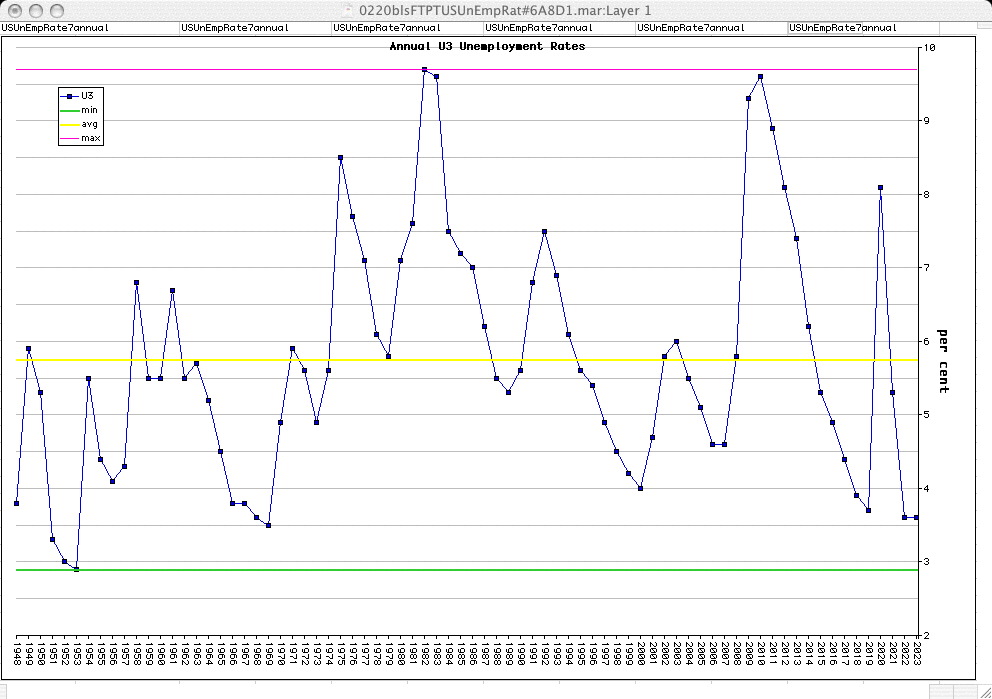
USA UnEmployment Rates U-3 (with minimum, average, maximum since 1948)
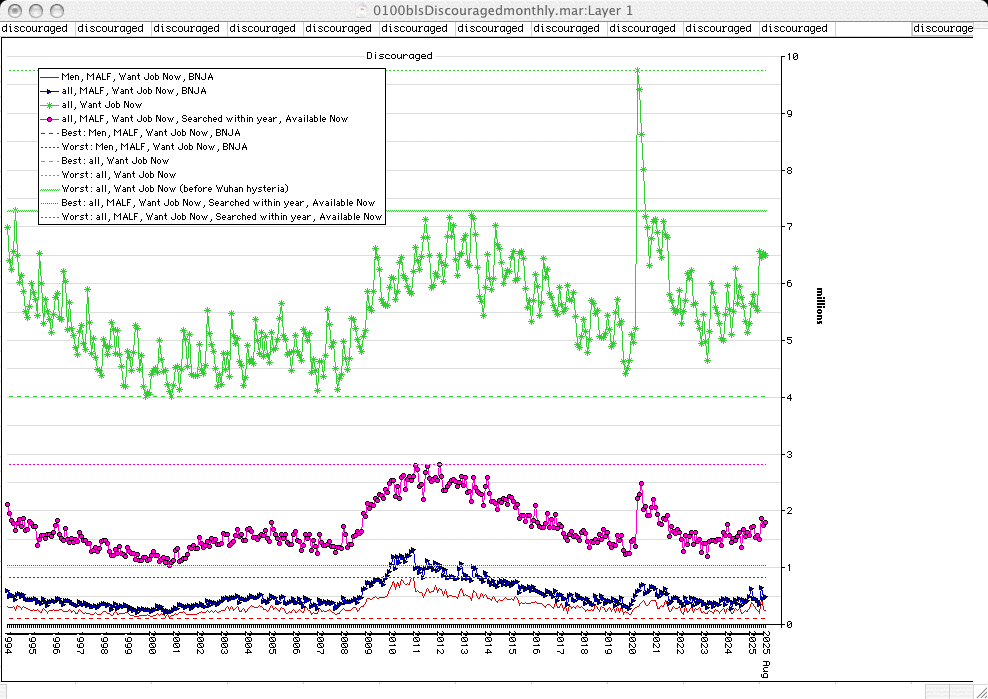
Discouraged (seeking & not finding, want employment but gave up seeking, marginally attached to labor force...)
Discouraged
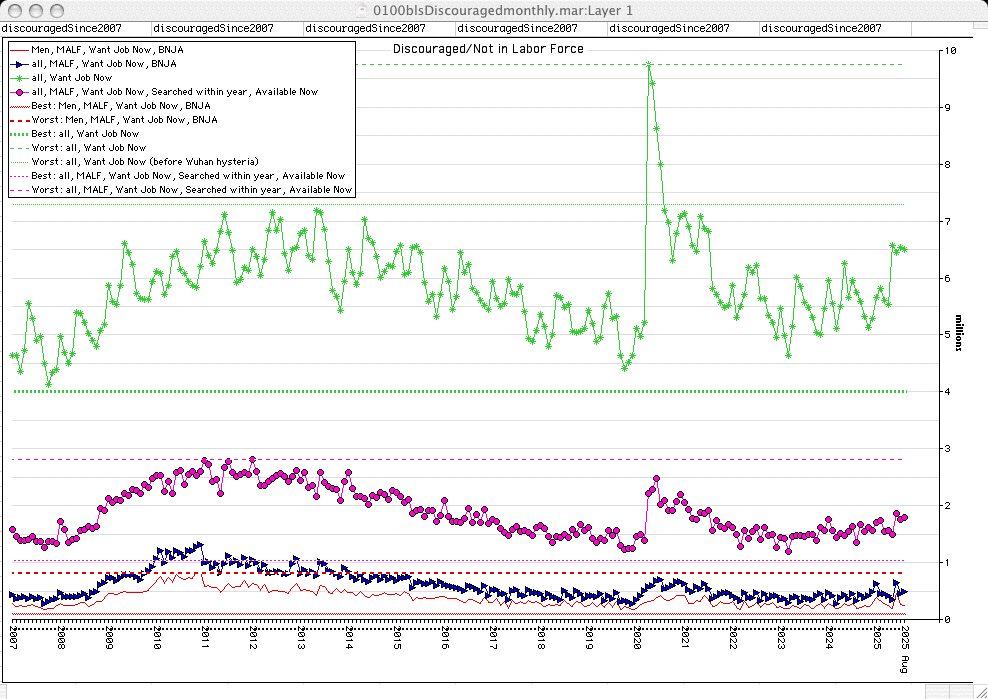
Discouraged: Not in Labor Force, Searched For Work (within last 12 months, but not this month) and Available, Discouraged by Reasons For Not Currently Looking
Marginally Attached: Not in Labor Force, Searched For Work (within last 12 months, but not this month) and Available plus some of those who did search for work within the last month, but did not find work.
Discouraged since 2007
LNU05026646 (Men; MALF; Want Job Now; BNJA)
LNU05026645 (all, MALF, Want Job Now, BNJA)
LNU05026639 (all, Want Job Now)
LNU05026642 (all, MALF, Want Job Now, Searched within year, Available Now)
all = both sexes, all races & ethnicities
MALF = marginally attached to "labor force"
BNJA = believes no jobs are currently available
retrieved from https://data.bls.gov/series-report
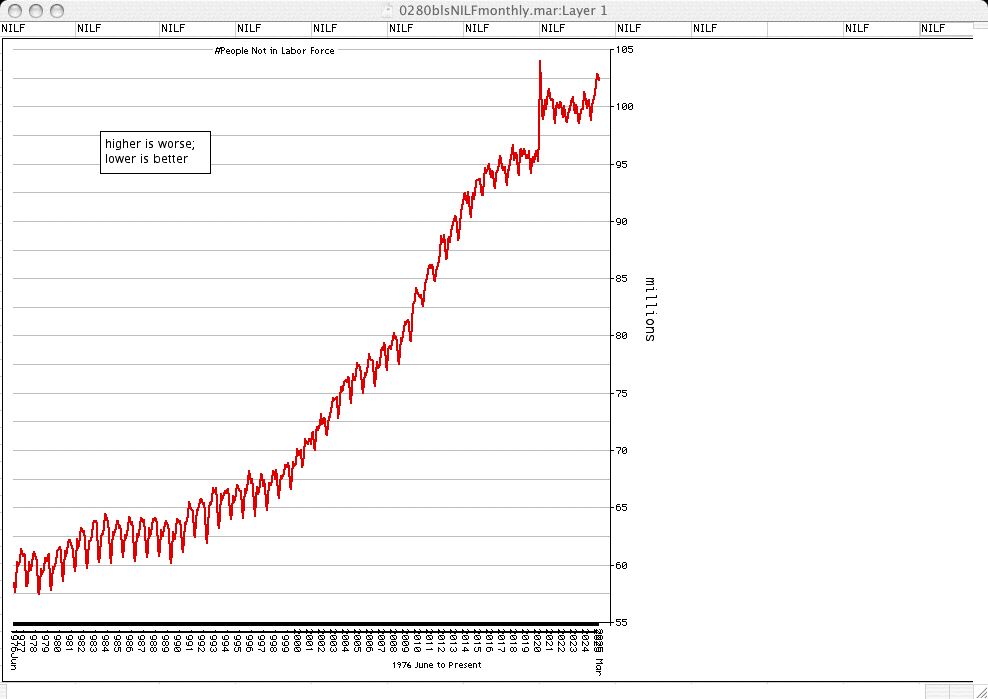
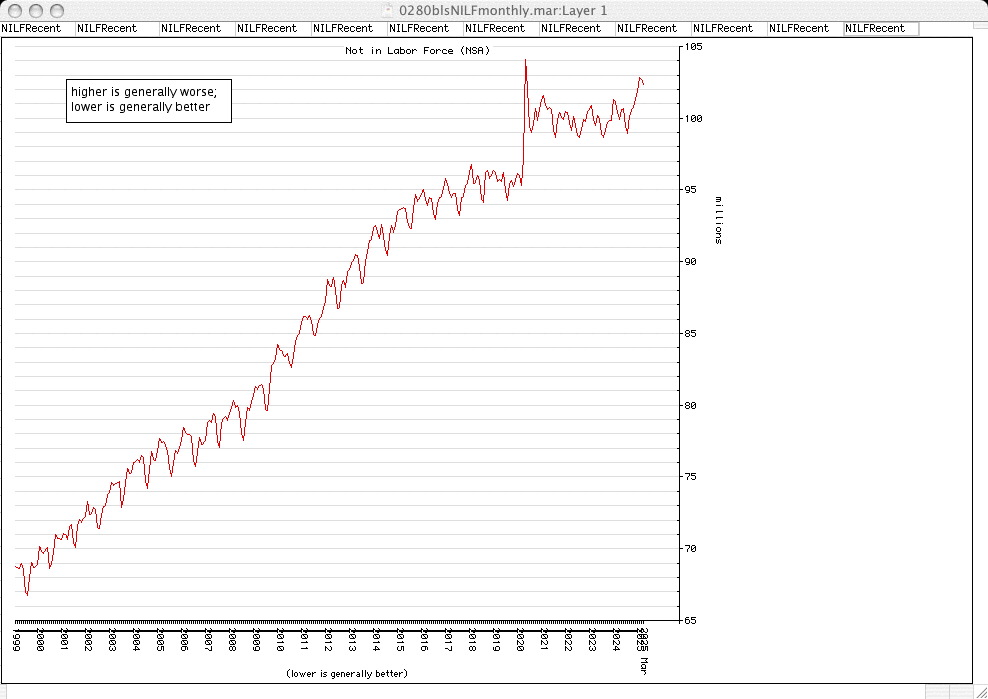
"Not in «Labor Force»" (NILF since 1976)
NILF (since 1999)
LNU05000000
retrieved from https://data.bls.gov/series-report
definitions (U1-U6)
definitions & most recent value table (U1-U6)
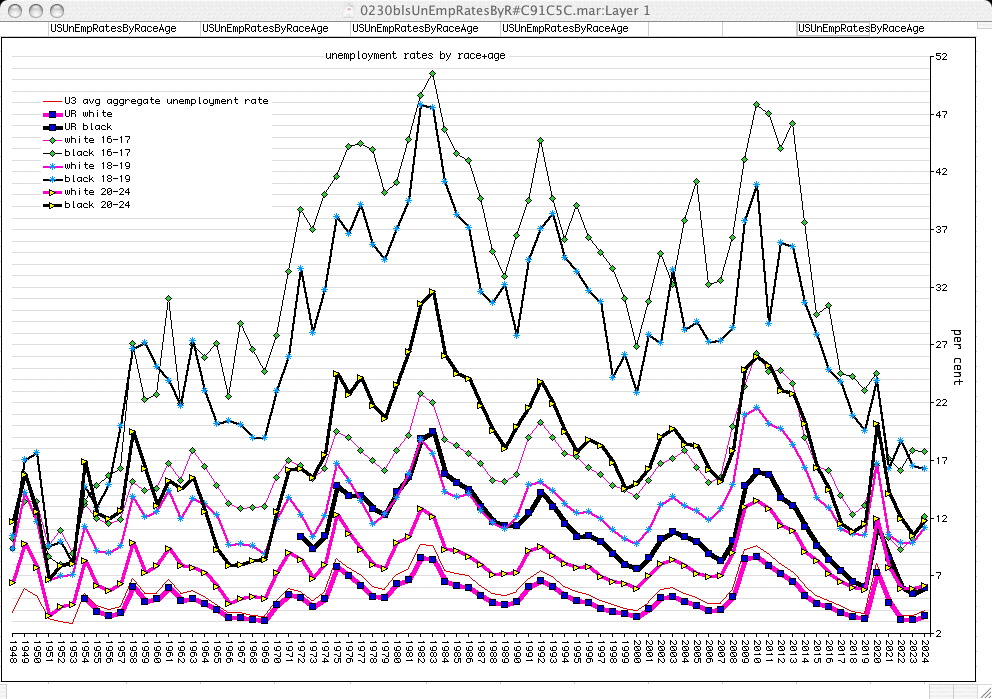
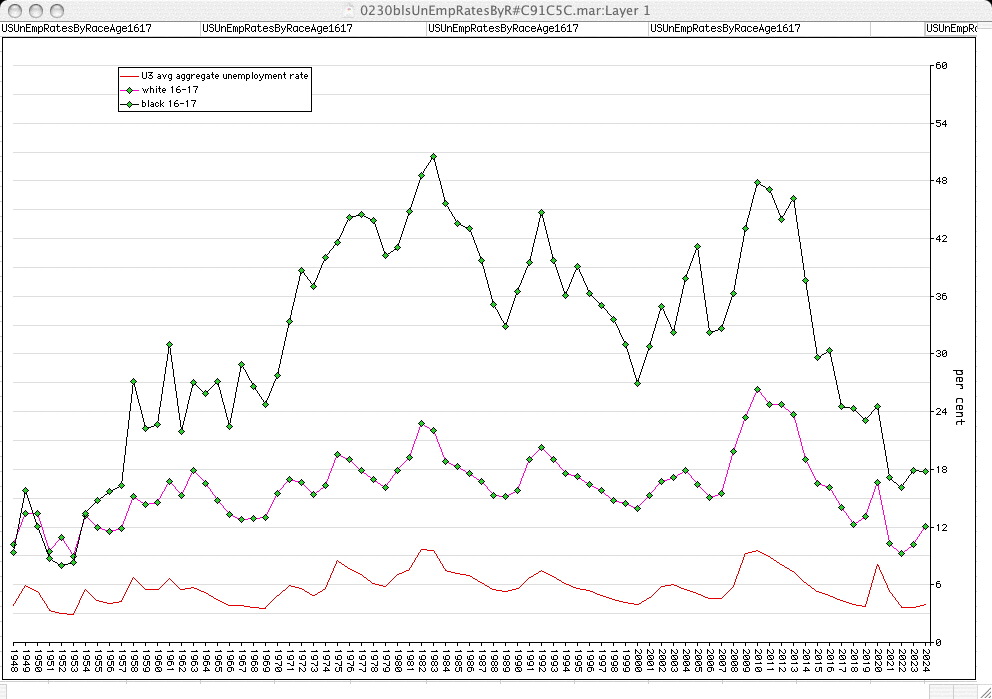
"Race" & Age
US UnEmployment Rates by Race & Age (annual)
LNU04000000 (U3)
LNU04000003 ("whites")
LNU04000006 ("blacks")
LNU04000110 ("whites" 16-17)
LNU04000138 ("blacks" 16-17)
LNU04000112 ("whites" 18-19)
LNU04000140 ("blacks" 18-19)
LNU04000039 ("whites" 20-24)
LNU04000042 ("blacks" 20-24)
US UnEmployment Rates by Race & 16-17 years old (annual)
graph inspired by late economist Walter Edward Williams, Ph.D.s 1982 _The State Against Blacks_ pp37-38
who cited BLS HandBook of Labor Statistics 1975 pp153-155
and BLS Employment and Unemployment in 1976 special labor force report 199 (1977)
retrieved from https://data.bls.gov/series-report
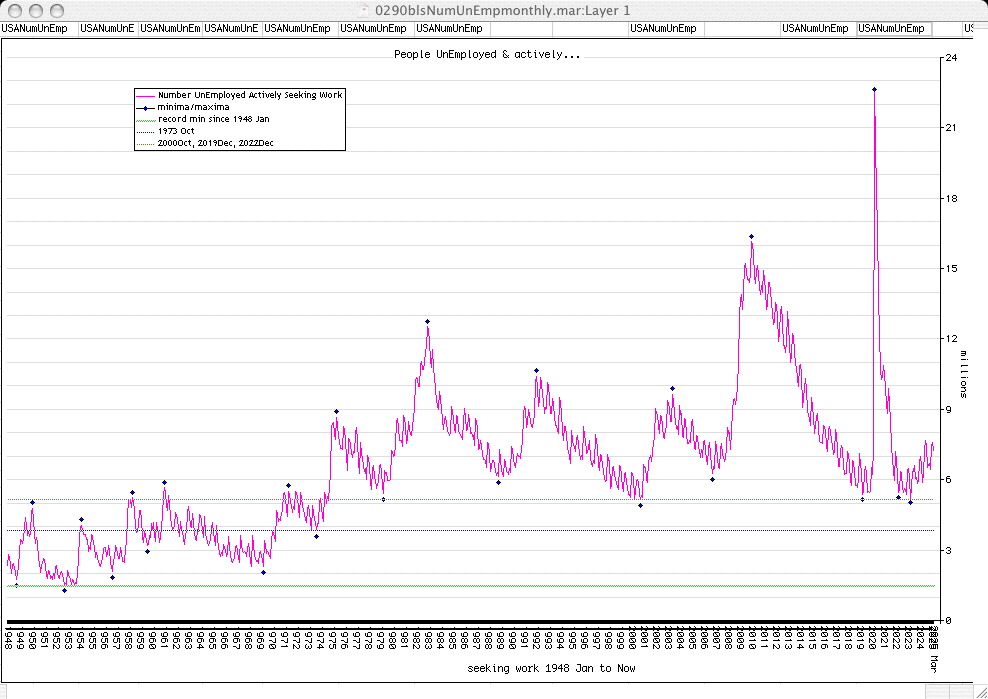
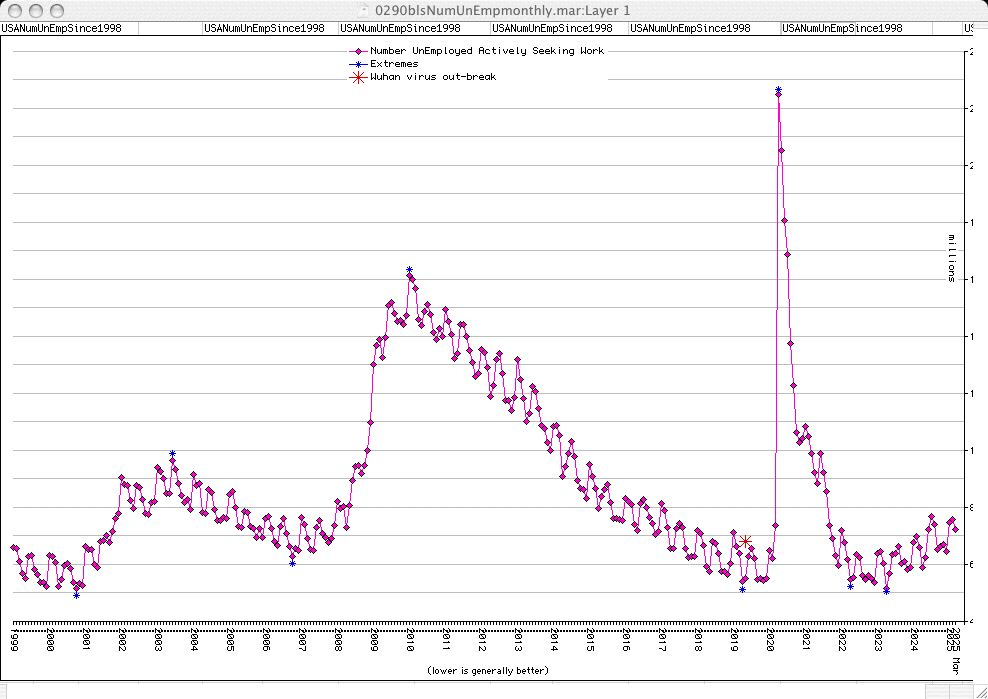
Numbers Unemployed
Please note that the effects of the Wuhan coronavirus/covid-19/SARS-cov-2/ncov/novel Betacoronavirus/Pelosi/BiteMe/Cuomo disease 🦠 pandemic out-break on USA job markets did not kick in until the media ramped up their hysteria, and governments' shut downs of businesses & lock-downs ⛓ 🔒 of individuals. Investigators suggest the earliest evidence of the out-break has been pushed back to 2019 May, when the research center ramped up acquisitions of equipment needed to test for it. Earlier, the estimate was in 2019 August based on internet communications & aerial & satellite images showing a sudden increase in vehicle traffic and parking lot occupation as people were taken by ambulance or drove to hospitals in the area. The first major news coverage in the USA seemed to begin in 2020 late January with reports of the Princess cruise ship quarantine. As it turned out, only a small percentage of those on the ship, even though it was crowded, became infected, and a still smaller percentage required hospitalization. But better safe than sorry when fatality rates were still wild guesses, and international traveler testing & quarantines were months too late being started, leaving barn doors half open long after the horse & horsemen had been flying at 500+ miles per hour around the globe, and doctors were discouraged by government health "authorities" for years from even trying safe & effective treatments to address specific patient symptoms as they were observed.
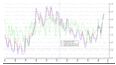
USA Number Unemployed & Actively Seeking Work (USA UEASW since 1948)
USA Number Unemployed & Actively Seeking Work (USA UEASW since 1998)
LNU03000000
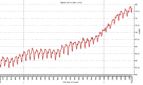
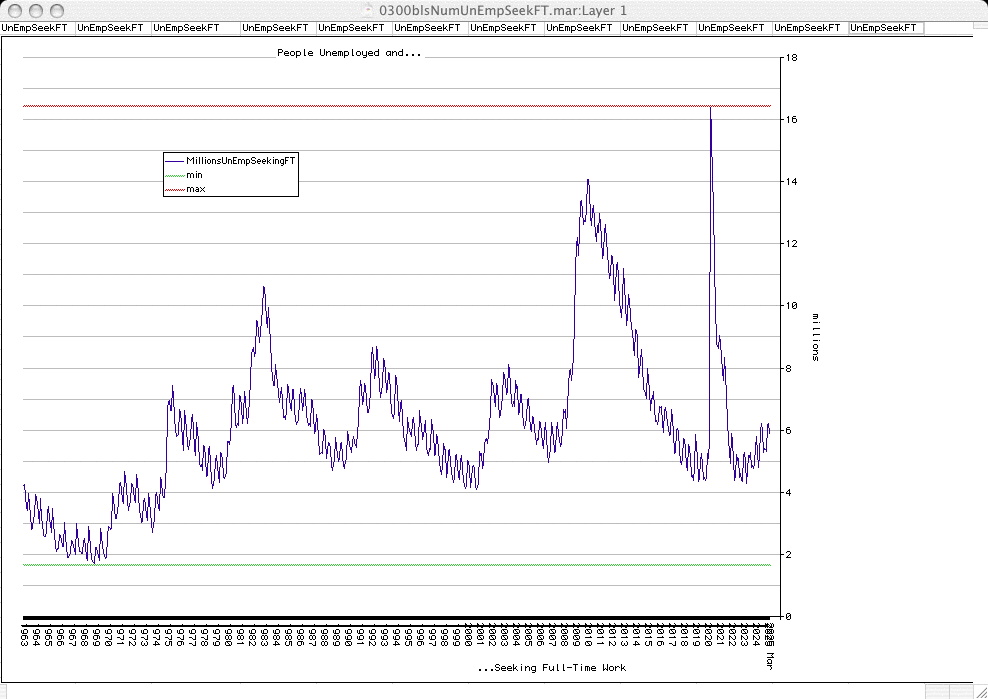
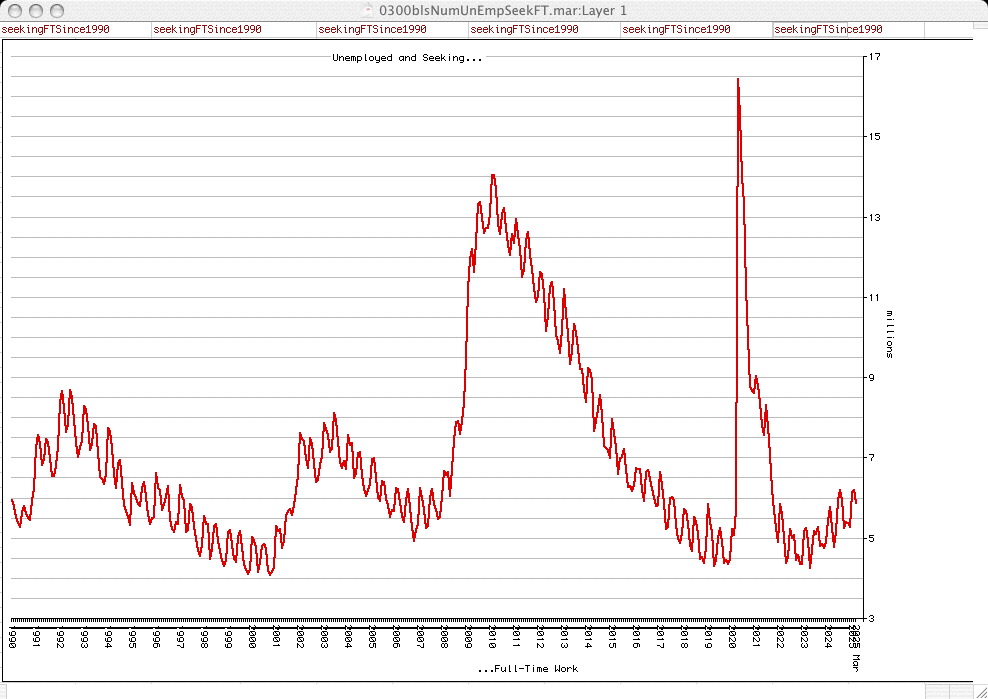
USA Number Unemployed & actively seeking Full-Time work (UEASFTW since 1963)
USA Number Unemployed & Actively Seeking Full-Time Work (UEASFTW since 1990)
LNU03100000
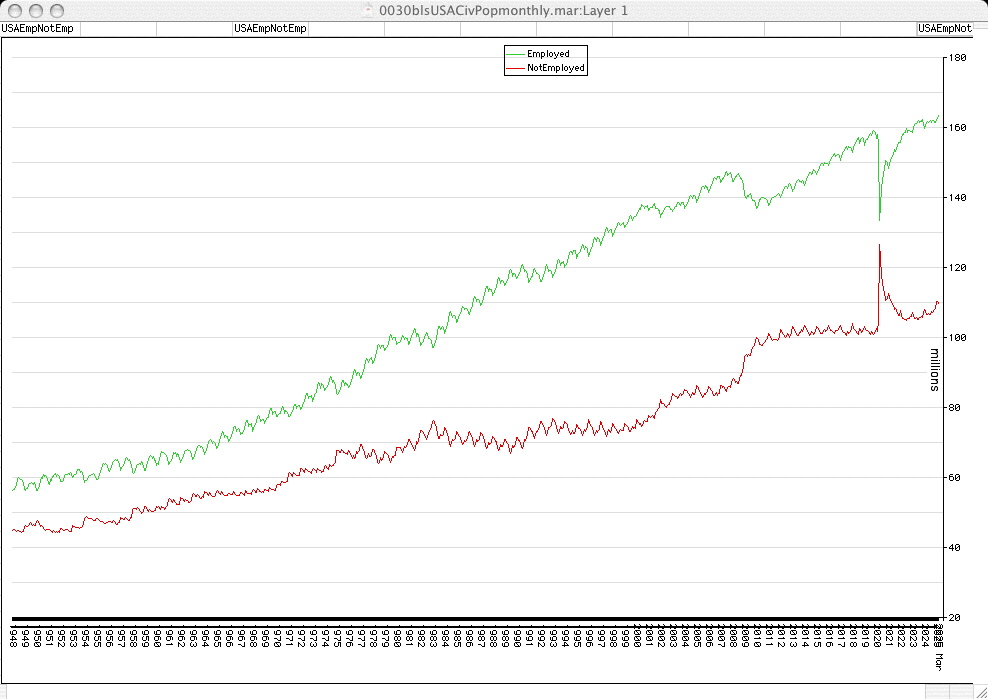
USA Number Employed & Number Not Employed since 1948
LNU02000000 (Employed)
LNU05000000 (NILF not in "labor force")
LNU03000000 (UEASW UnEmployed actively seeking work)
NILF + UEASW = Not Employed
It has come to my attention in the last few months that BLS considers some people actively searching for work to be "NOT actively seeking work", therefore "not in the labor force", not in the divisor for calculating unemployment rates.
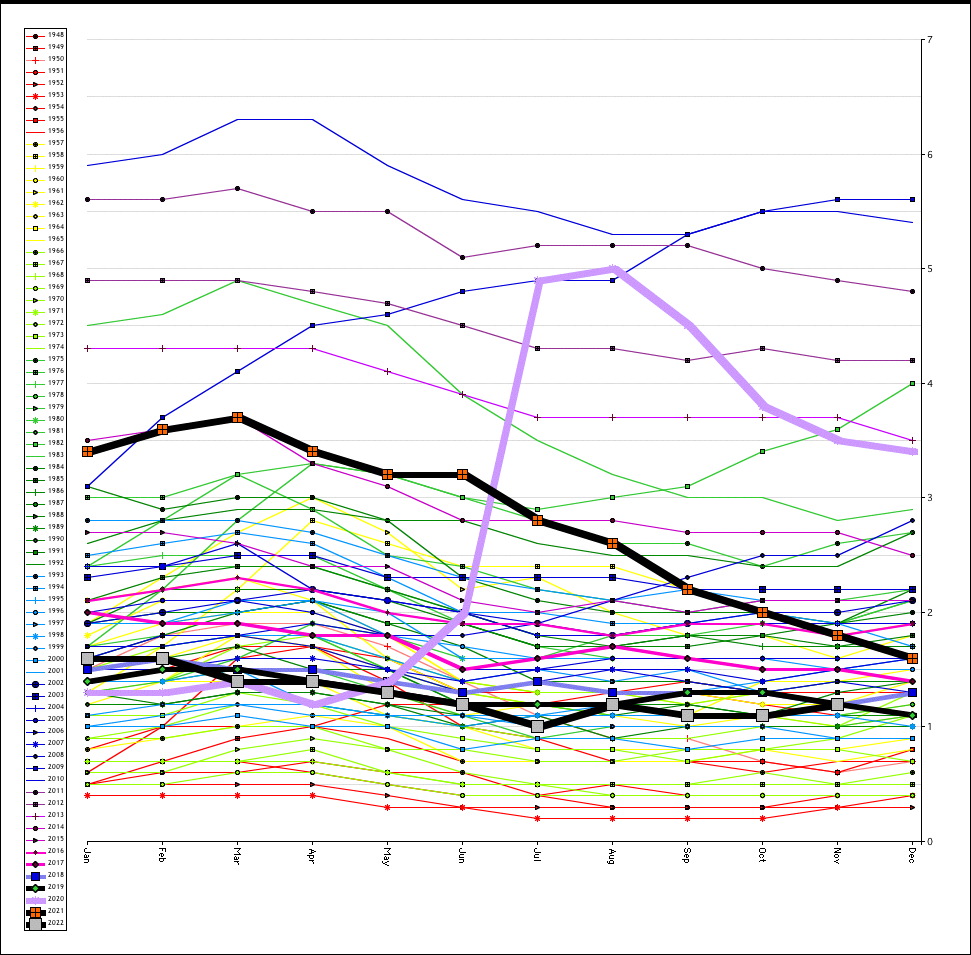
Unemployment Rages (1 graph for each of U1 through U6, with a separate curve for each year)
per cent unemployed 15+weeks (U-1) year over year
LNU03025670
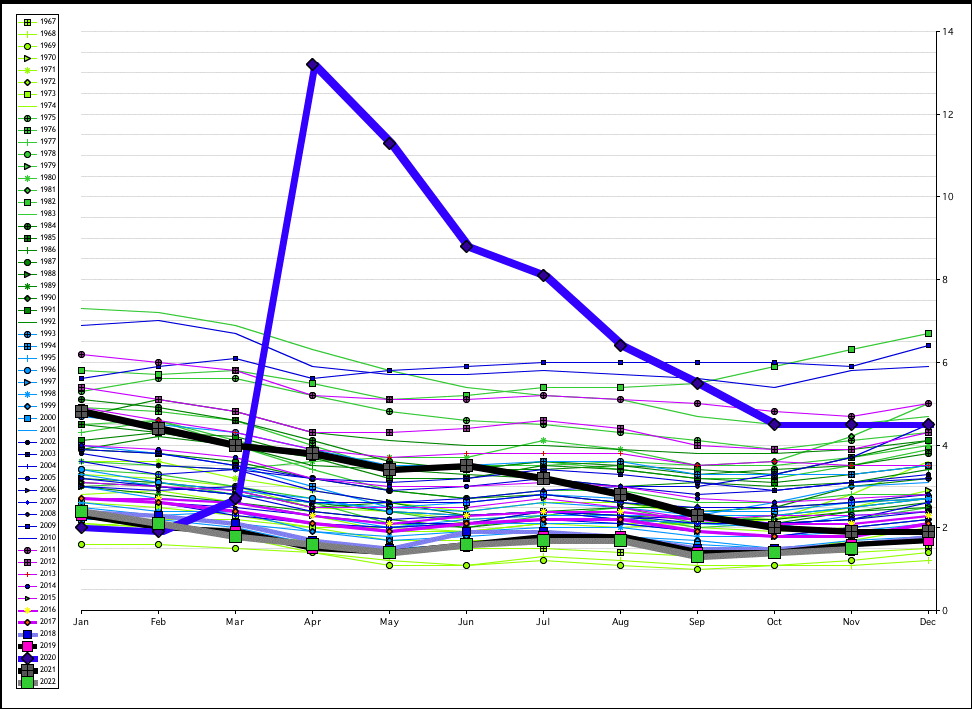
per cent unemployed bodies shopped (U-2) year over year
LNU04023621
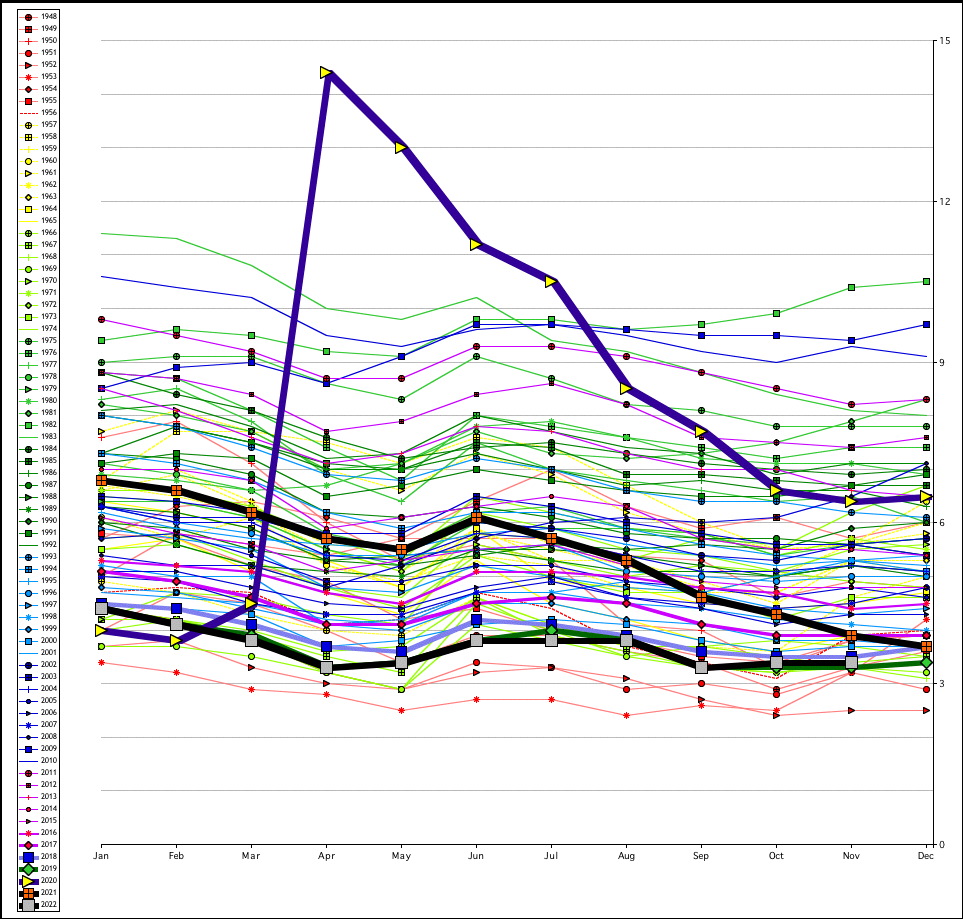
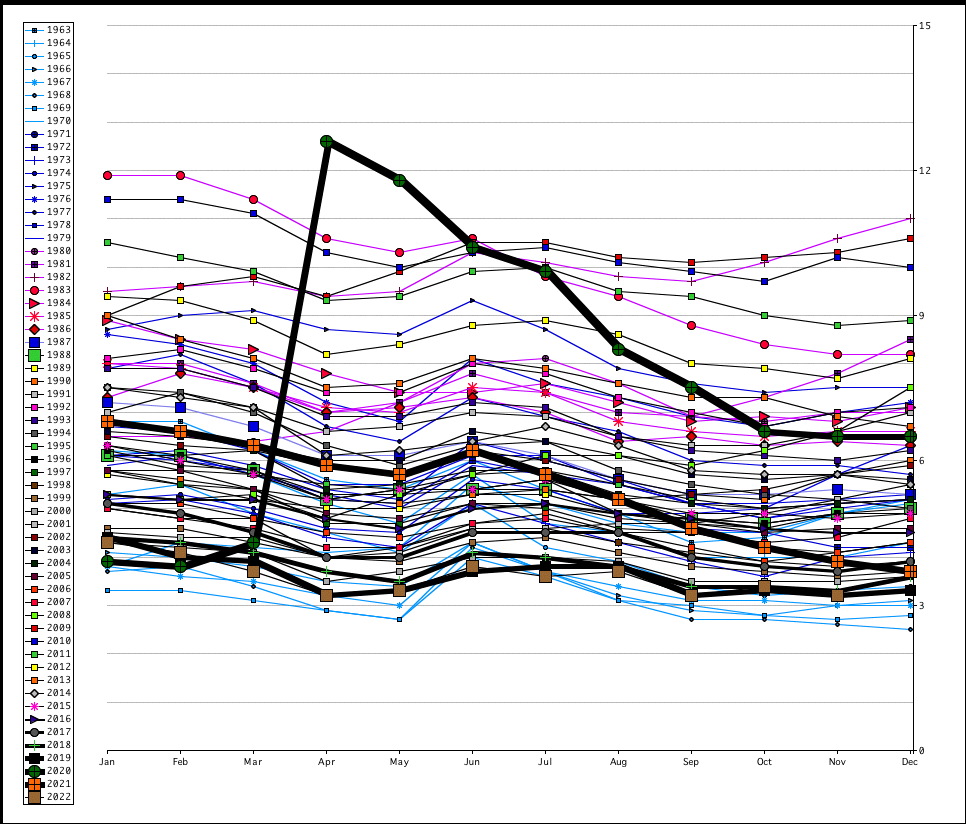
"publicized" unemployment rate (U-3) year over year
LNU04000000
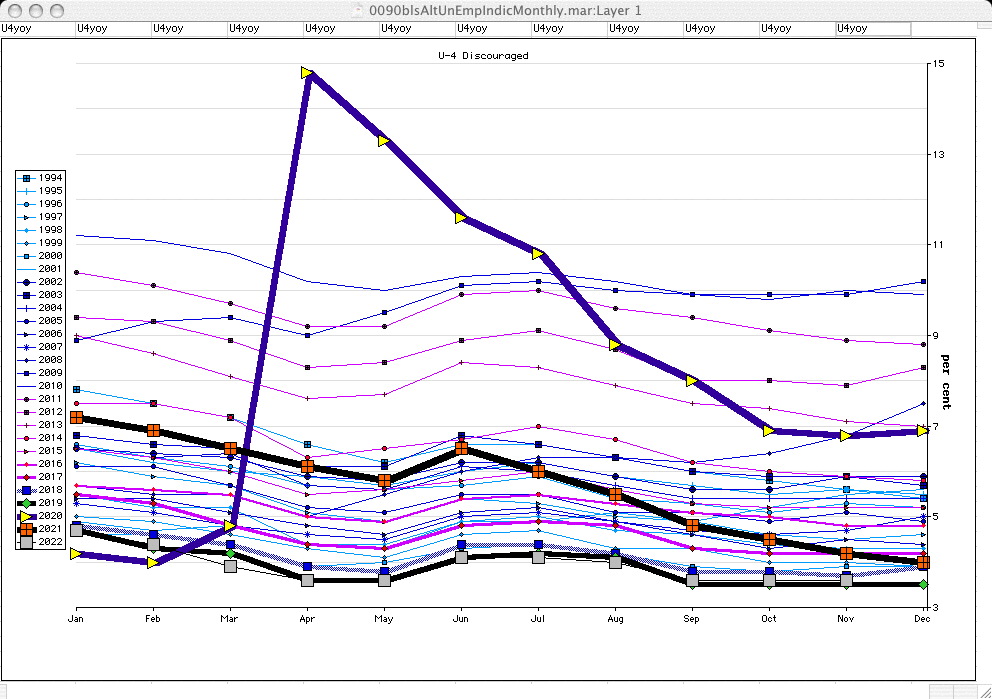
per cent normal + discouraged unemployed (U-4) year over year
LNU03327707
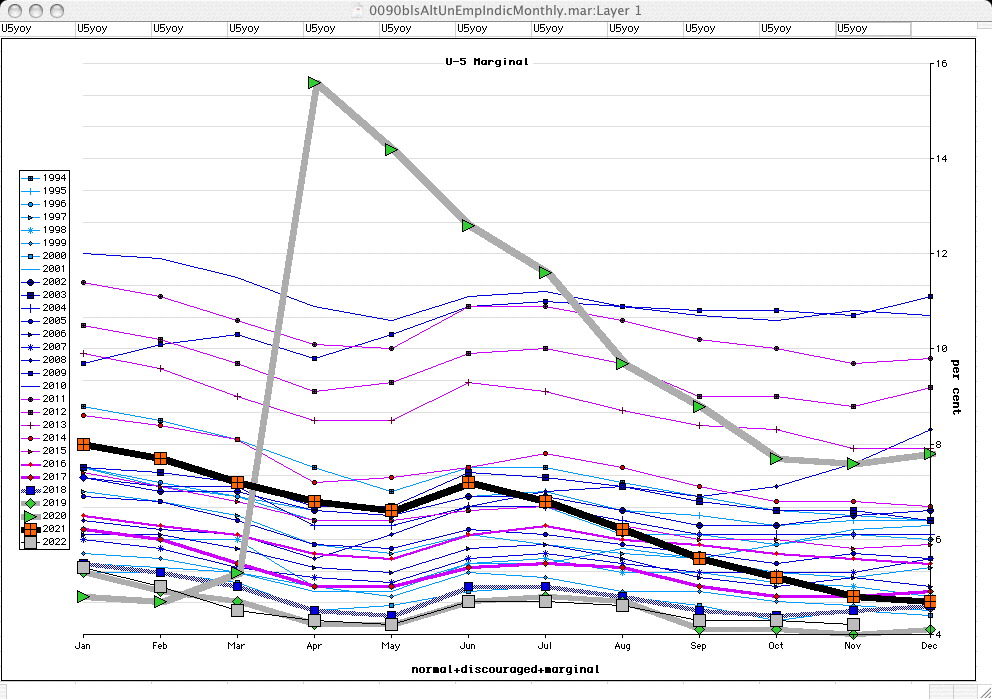
per cent of normal+discouraged+marginal unemployed (U-5) year over year
LNU03327708
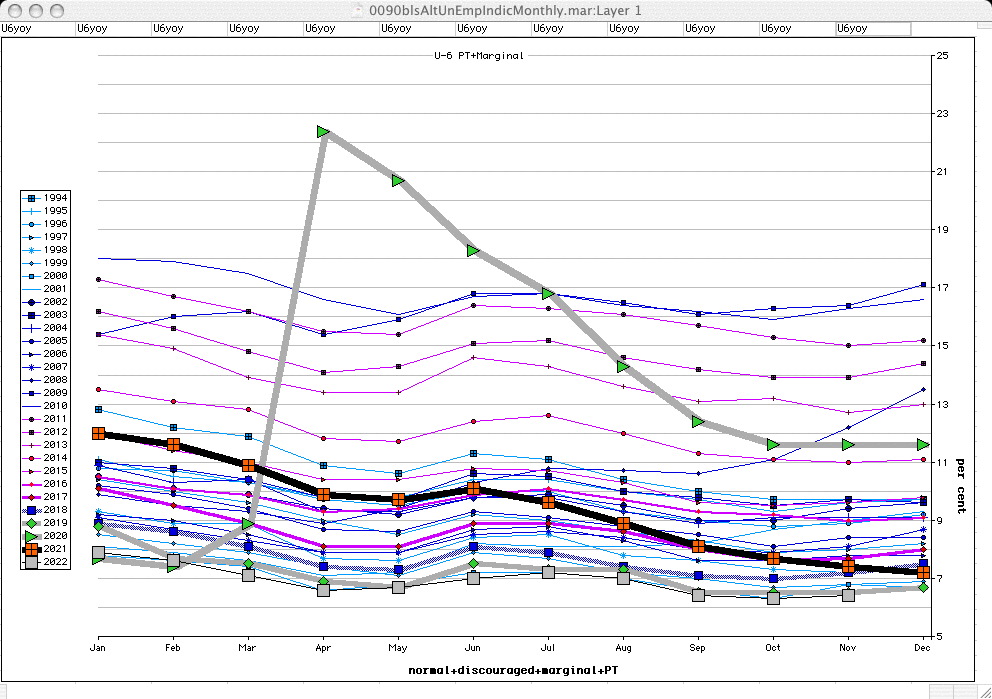
per cent of normal+discouraged+marginal+part-time (U-6) year over year
LNU03327709
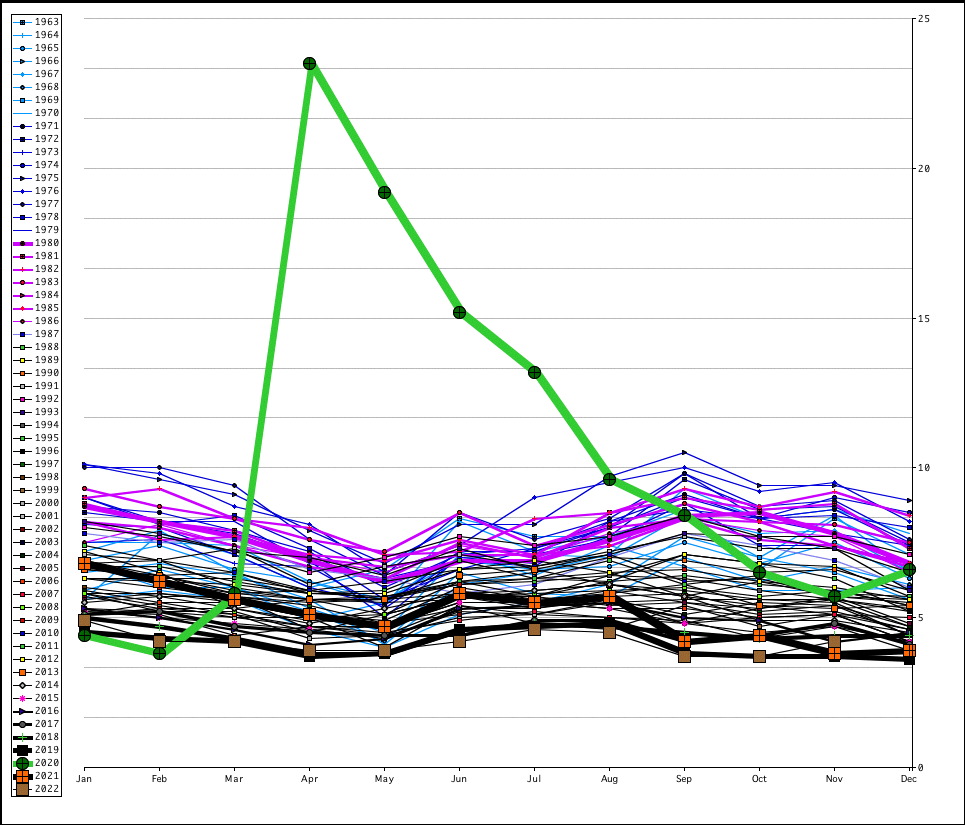
Full-Time unemployment rate year over year
LNU04100000
Part-Time unemployment rate year over year
LNU04200000
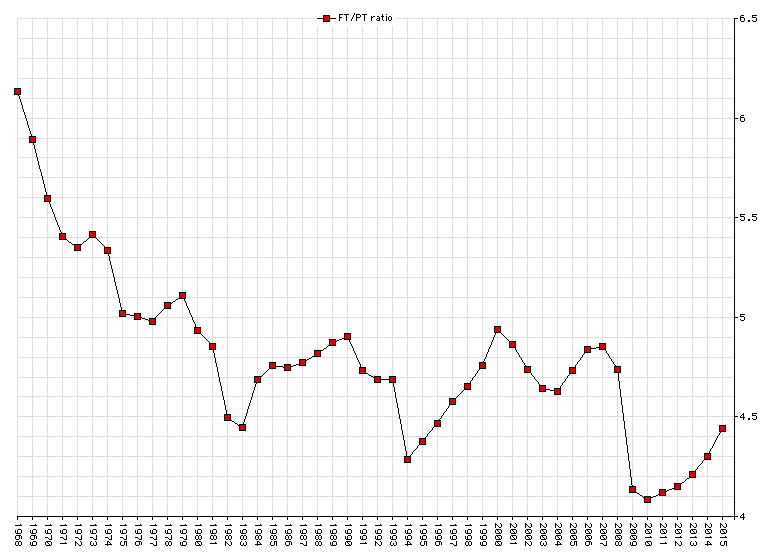
Ratio of Number Usually Employed Full-time/Number Usually Employed Part-time (annual)
LNU02500000
LNU02600000
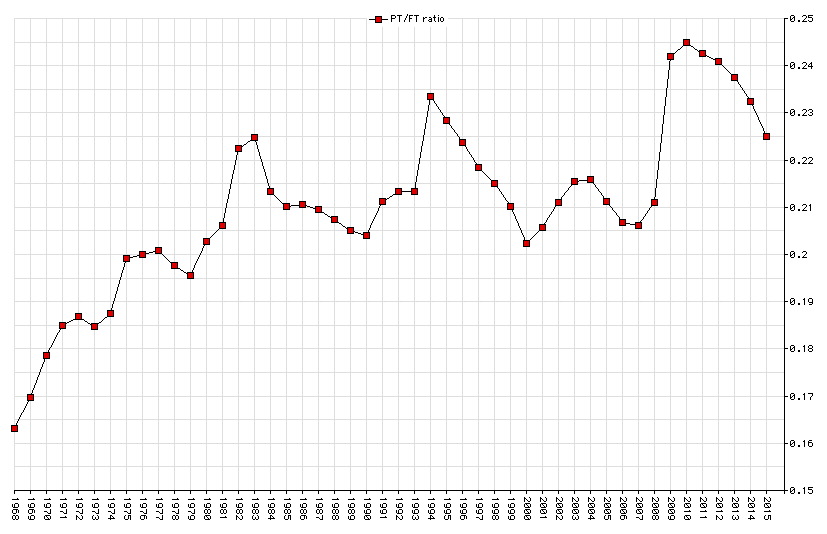
Ratio of Number Usually Employed Part-time/Number Usually Employed Full-time (annual)
LNU02600000
LNU02500000
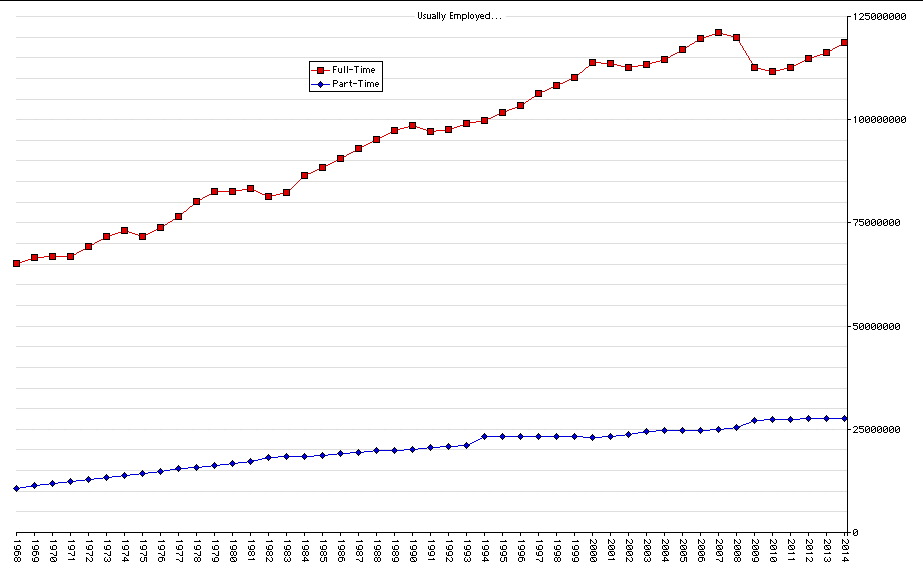
Usually Employed: Full-time compared with Part-time
link to new page
Labor Force Participation Rates
Ratios of Numbers Employed to Civilian Population (Emp/Pop, a.k.a. work rate, a.k.a. civilian employment rate)
page of graphs of Jobs Dearth/ insufficiency/ shortfall/ shortage estimates
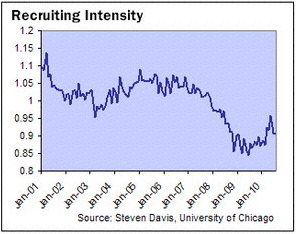
Recruiting Intensity
Hardly any of these actually attempt to measure elements of serious attempts to recruit employees. Instead, they use 2nd-order substitutes which they assume are the results of intensity levels in recruiting, such as time to fill a vacancy, rather than amounts spent on advertising, numbers & duration of ad placements, not offers of new-hire training (time, substance, amount invested, temporary housing), not willingness to invest in relocating talent (whether retained employees or new-hires; transportation to general vicinity, temporary housing, temporary transportation, laundry, food), not willingness to fly in candidates for interviews (whether measured in dollars, numbers of candidates...). Neither DoL nor BLS have ever tried to track aggregate employer investment in training (neither new-hires nor retained employees). Pffft! None of them are serious about this; they apparently think lifting a finger is too much effort. And so the USA remains close to 30M short of full employment as experienced post-WW2.
Recruiting Intensity Index: Steven J. Davis, U of Chicago and others
R. Jason Faberman: Federal Reserve Bank of Chicago/IZA (pdf)
R. Jason Faberman: Federal Reserve Bank of Chicago/IZA
Steven J. Davis: FRED/Federal Reserve Bank of St. Louis/DHI Group, Inc. (discontinued; covers only 2001 through 2019 April)
2016-09-19: Alessandro Gavazza, Simon Mongey & Giovanni L. Violante: NYU: aggregate recruiting intensity (pdf)
2012: Steven J. Davis, R. Jason Faberman & John C. Haltiwanger: American Economic Association: recruiting intensity during & after the mortgage melt-down/great recession (pdf)
2012: Steven J. Davis, R. Jason Faberman & John C. Haltiwanger: American Economic Association: recruiting intensity during & after the mortgage melt-down/great recession (pdf)
2016-09-12: Nick Hunter: "Washington Center for «Equitablet» Growth": recruiting intensity: are employers really trying to find & hire USA citizen job-seekers?... or hardly looking?
2020-10-01: Alicia Sasser Modestino, Daniel Shoag & Joshua Ballance: MIT/Review of Economics & Statistics: hyper-credentialism: do employers demand more/different credentials (though not necessarily higher skill levels) when able & willing workers are plentiful?
2021 January: Benjamin Lochner, Christian Merkl, Heiko Stueber & Nicole Guertzgen: Labour Economics: recruiting intensity and hiring practices
2022-02-11: Eliza Forsythe & Russell Weinstein: UIUC: recruiting intensity, hires, and vacancies: evidence from firm-level data
2010 March/April
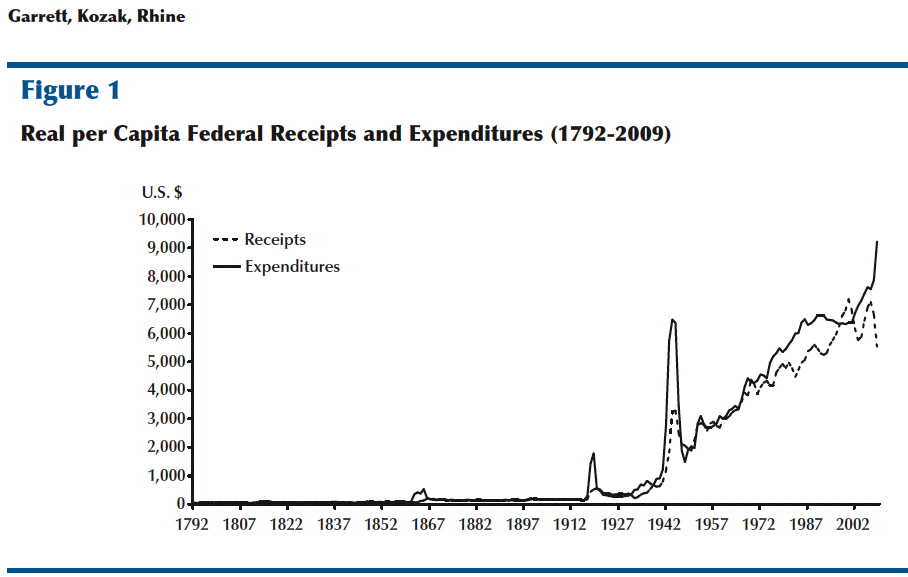
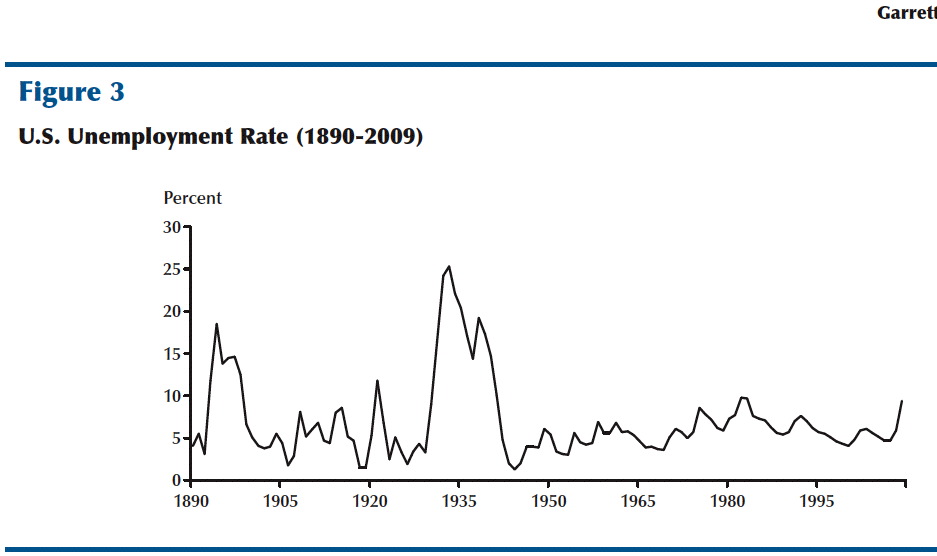
Thomas A. Garrett, Andrew F. Kozak & Russell M. Rhine _Cite Seer X_/_Federal Reserve Bank of St. Louis Review_/_Pennsylvania State U_
Institutions and Government Growth: A Comparison of the 1890s and the 1930s
"For example, annual federal government per capita spending averaged $125 from 1792 to 1929 with no trend increase [inflation-adjusted 2000 dollars; OMB _Budget of the United States Government, Historical Tables_]. However, real [inflation-adjusted] federal government per capita spending rose from roughly $250 in 1930 to neary $9,200 in 2007."
federal government revenues, spending, surplus/deficit 1789 to 2009
unemployment rates 1890 to 2009
ShadowStats unemployment
Federal Reserve of St. Louis Employment/Population graph and data
St. Louis Fed pay-rolls since late 1930s
FRED Federal Reserve Bank of St. Louis: health care employment
FRED Federal Reserve Bank of St. Louis: private education + health care services employment
Federal Reserve of St. Louis un-employment by years of enduring educationism
Christian Zimmermann: Federal Reserve of St. Louis "natural" un-employment rate natural rate of un-employment (NROU) based on CBO
"full employment" (wikipedia) non-accelerating inflation rate of unemployment
Abbreviations, Definitions, & Descriptions:
Abbreviations:
CivPop = CNIP16+ =
- civilian, non-institutionalized population 16 years old & older = employed + not-employed = employed + UEASW + NILF CLF16+ + NILF
UEASW =
- unemployed and actively seeking work (except for some who did actively search for work but did not find any)
CLF16+ =
- civilian labor force 16 years old & older = employed + unemployed and actively seeking work = employed + UEASW
NILF =
- not in labor force = not employed and not actively seeking work (or possibly actively searching for work but not finding work)
unemployment rate = U3 =
- the percentage UEASW/CLF16+ * 100 (this is the most commonly reported indicator)
not-employed =
- NILF + UEASW
EmpPT =
- employed part-time
EmpFT =
- employed full-time
EmpPTForNonEconReasons =
- employed part-time for non-economic reasons (i.e. part-time work was freely chosen as a personal preference and not because full-time jobs are not available)
EmpPTForEconReasons =
- employed part-time for economic reasons (i.e. full-time jobs are not available or workable due to financial/economic constraints)
Emp/Pop = Emp/Pop ratio =
- numbers in category who are employed as per cent of civilian population for the category = number employed/civilian non-institutionalized population for the category * 100 (where category can be age range, sex, race/ethnicity, occupation, industry, education level, citizen, non-citizen, native, foreign-born...)
Discouraged =
- Not in Labor Force, Searched For Work (within last 12 months, but not this month) and Available, Discouraged with Reasons For Not Currently Looking
Marginally Attached =
- Not in Labor Force, Searched For Work (within last 12 months, but not this month) and Available
LFPR =
- labor force participation rate(s) = (UEASW+employed)/CNIP (for category)
--- historical ---
CNIP14+ =
- civilian, non-institutionalized population 14 years old & older
CLF14+ =
- civilian labor force 14 years old & older = employed + unemployed and actively seeking work
Civilian, non-institutionalized population, 16 years and older
glossary (BLS)
e-mail jgo
(ottO .G nhoJ)
External links may expire at any time.
Neither this page, nor the opinions expressed or implied in it are endorsed by Michael Badnarik, Ron Paul, Binyamin L. Jolkovsky, Bob Barr, Walter E. Williams, Wayne Allyn Root, Thomas Sowell, Warner Brothers, Gary Johnson, Peter Brimelow, president Donald Trump, nor by my hosts, Kermit and Rateliff.
Page Top

